
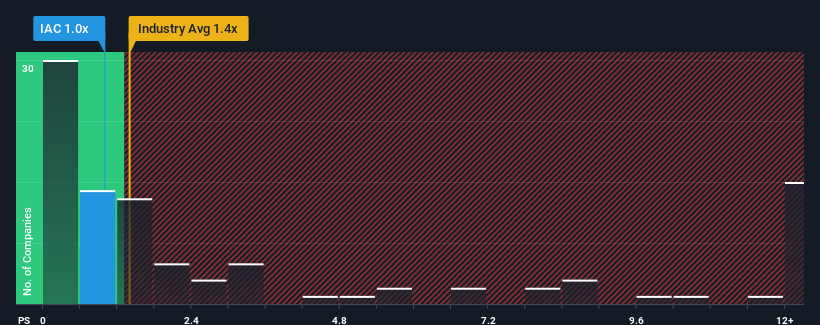
It's not a stretch to say that IAC Inc.'s (NASDAQ:IAC) price-to-sales (or "P/S") ratio of 1x right now seems quite "middle-of-the-road" for companies in the Interactive Media and Services industry in the United States, where the median P/S ratio is around 1.4x. Although, it's not wise to simply ignore the P/S without explanation as investors may be disregarding a distinct opportunity or a costly mistake.
What Does IAC's P/S Mean For Shareholders?
IAC hasn't been tracking well recently as its declining revenue compares poorly to other companies, which have seen some growth in their revenues on average. It might be that many expect the dour revenue performance to strengthen positively, which has kept the P/S from falling. You'd really hope so, otherwise you're paying a relatively elevated price for a company with this sort of growth profile.
Want the full picture on analyst estimates for the company? Then our free report on IAC will help you uncover what's on the horizon.Do Revenue Forecasts Match The P/S Ratio?
The only time you'd be comfortable seeing a P/S like IAC's is when the company's growth is tracking the industry closely.
Taking a look back first, the company's revenue growth last year wasn't something to get excited about as it posted a disappointing decline of 16%. However, a few very strong years before that means that it was still able to grow revenue by an impressive 44% in total over the last three years. Accordingly, while they would have preferred to keep the run going, shareholders would definitely welcome the medium-term rates of revenue growth.
Shifting to the future, estimates from the eleven analysts covering the company suggest revenue should grow by 0.04% each year over the next three years. That's shaping up to be materially lower than the 12% per year growth forecast for the broader industry.
With this information, we find it interesting that IAC is trading at a fairly similar P/S compared to the industry. It seems most investors are ignoring the fairly limited growth expectations and are willing to pay up for exposure to the stock. These shareholders may be setting themselves up for future disappointment if the P/S falls to levels more in line with the growth outlook.
What Does IAC's P/S Mean For Investors?
Typically, we'd caution against reading too much into price-to-sales ratios when settling on investment decisions, though it can reveal plenty about what other market participants think about the company.
Given that IAC's revenue growth projections are relatively subdued in comparison to the wider industry, it comes as a surprise to see it trading at its current P/S ratio. At present, we aren't confident in the P/S as the predicted future revenues aren't likely to support a more positive sentiment for long. A positive change is needed in order to justify the current price-to-sales ratio.
The company's balance sheet is another key area for risk analysis. You can assess many of the main risks through our free balance sheet analysis for IAC with six simple checks.
It's important to make sure you look for a great company, not just the first idea you come across. So if growing profitability aligns with your idea of a great company, take a peek at this free list of interesting companies with strong recent earnings growth (and a low P/E).
Have feedback on this article? Concerned about the content? Get in touch with us directly. Alternatively, email editorial-team (at) simplywallst.com.
This article by Simply Wall St is general in nature. We provide commentary based on historical data and analyst forecasts only using an unbiased methodology and our articles are not intended to be financial advice. It does not constitute a recommendation to buy or sell any stock, and does not take account of your objectives, or your financial situation. We aim to bring you long-term focused analysis driven by fundamental data. Note that our analysis may not factor in the latest price-sensitive company announcements or qualitative material. Simply Wall St has no position in any stocks mentioned.