
Despite an already strong run, Parkson Retail Asia Limited (SGX:O9E) shares have been powering on, with a gain of 39% in the last thirty days. Not all shareholders will be feeling jubilant, since the share price is still down a very disappointing 10% in the last twelve months.
Even after such a large jump in price, Parkson Retail Asia's price-to-sales (or "P/S") ratio of 0.3x might still make it look like a buy right now compared to the Multiline Retail industry in Singapore, where around half of the companies have P/S ratios above 0.8x and even P/S above 4x are quite common. However, the P/S might be low for a reason and it requires further investigation to determine if it's justified.
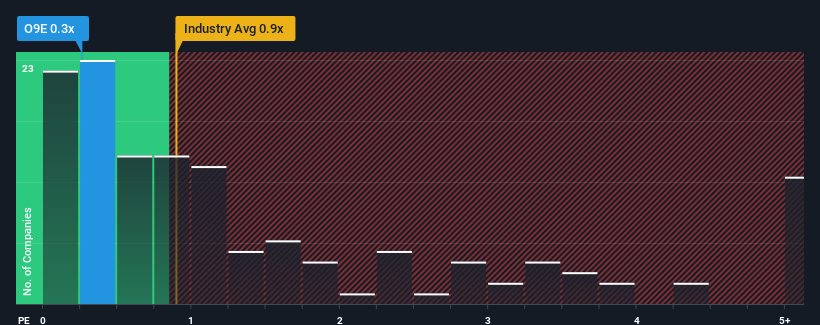
SGX:O9E Price to Sales Ratio vs Industry June 3rd 2024
What Does Parkson Retail Asia's Recent Performance Look Like?
For example, consider that Parkson Retail Asia's financial performance has been poor lately as its revenue has been in decline. One possibility is that the P/S is low because investors think the company won't do enough to avoid underperforming the broader industry in the near future. Those who are bullish on Parkson Retail Asia will be hoping that this isn't the case so that they can pick up the stock at a lower valuation.
Although there are no analyst estimates available for Parkson Retail Asia, take a look at this free data-rich visualisation to see how the company stacks up on earnings, revenue and cash flow.
How Is Parkson Retail Asia's Revenue Growth Trending?
There's an inherent assumption that a company should underperform the industry for P/S ratios like Parkson Retail Asia's to be considered reasonable.
In reviewing the last year of financials, we were disheartened to see the company's revenues fell to the tune of 6.3%. That put a dampener on the good run it was having over the longer-term as its three-year revenue growth is still a noteworthy 29% in total. Accordingly, while they would have preferred to keep the run going, shareholders would be roughly satisfied with the medium-term rates of revenue growth.
Comparing that to the industry, which is predicted to deliver 9.5% growth in the next 12 months, the company's momentum is pretty similar based on recent medium-term annualised revenue results.
In light of this, it's peculiar that Parkson Retail Asia's P/S sits below the majority of other companies. It may be that most investors are not convinced the company can maintain recent growth rates.
What We Can Learn From Parkson Retail Asia's P/S?
Despite Parkson Retail Asia's share price climbing recently, its P/S still lags most other companies. We'd say the price-to-sales ratio's power isn't primarily as a valuation instrument but rather to gauge current investor sentiment and future expectations.
The fact that Parkson Retail Asia currently trades at a low P/S relative to the industry is unexpected considering its recent three-year growth is in line with the wider industry forecast. When we see industry-like revenue growth but a lower than expected P/S, we assume potential risks are what might be placing downward pressure on the share price. revenue trends suggest that the risk of a price decline is low, investors appear to perceive a possibility of revenue volatility in the future.
You should always think about risks. Case in point, we've spotted 2 warning signs for Parkson Retail Asia you should be aware of.
If companies with solid past earnings growth is up your alley, you may wish to see this free collection of other companies with strong earnings growth and low P/E ratios.
Have feedback on this article? Concerned about the content? Get in touch with us directly. Alternatively, email editorial-team (at) simplywallst.com.
This article by Simply Wall St is general in nature. We provide commentary based on historical data and analyst forecasts only using an unbiased methodology and our articles are not intended to be financial advice. It does not constitute a recommendation to buy or sell any stock, and does not take account of your objectives, or your financial situation. We aim to bring you long-term focused analysis driven by fundamental data. Note that our analysis may not factor in the latest price-sensitive company announcements or qualitative material. Simply Wall St has no position in any stocks mentioned.