
To gain an edge, this is what you need to know today.
Hell To Pay
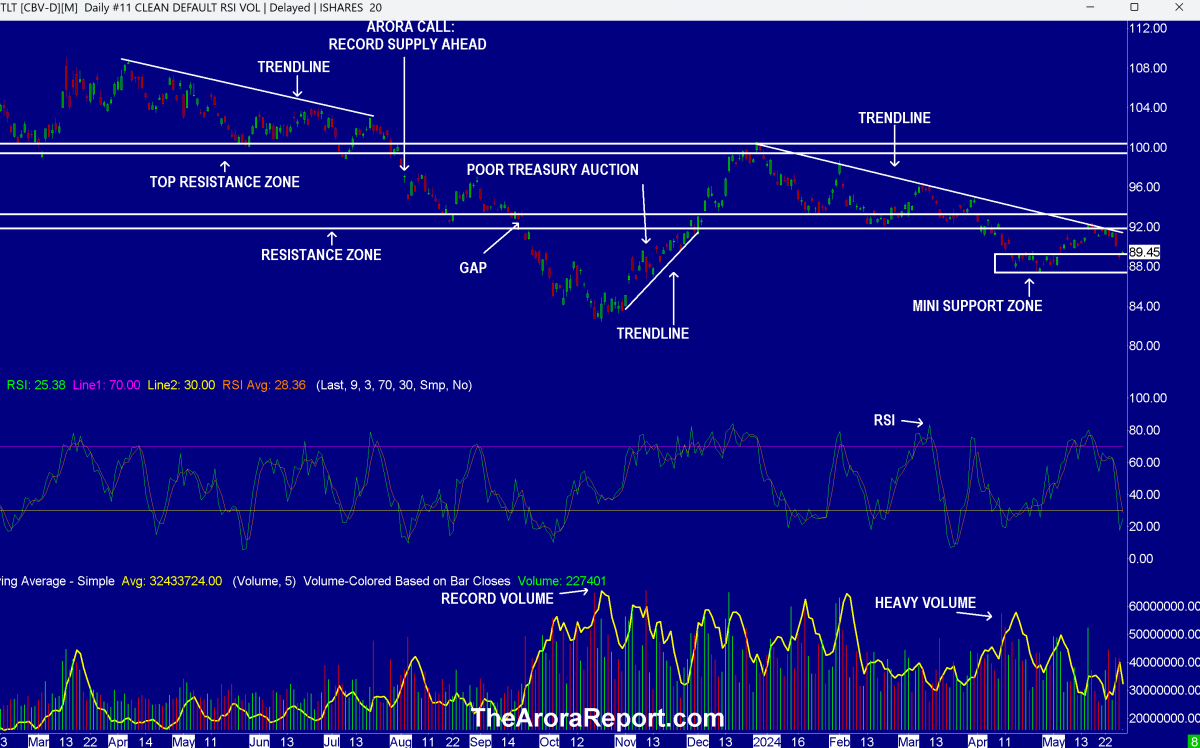
Please click here for an enlarged chart ofiShares 20+ Year Treasury Bond ETF(NASDAQ:TLT).
 Note the following:
- TLT moves inverse to long term yields. A fall in TLT means long term yields are rising. In this environment, rising yields are a big negative for the stock market.
- The chart shows that the rally in TLT failed at the trendline and close to the bottom of the resistance zone. This is a negative.
- The chart shows that TLT fell below the bottom band of the...
Login or create a forever free account to read this news
Sign up/Log in