
#黄金技术分析 #24K99讯 In the Asian market on Thursday (May 30), spot gold suddenly fell rapidly in the short term. The price of gold had just fallen below the $2,330 per ounce mark, falling sharply by nearly $10 during the day. FXStreet chief analyst Valeria Bednarik wrote an article analyzing the technical prospects of gold.
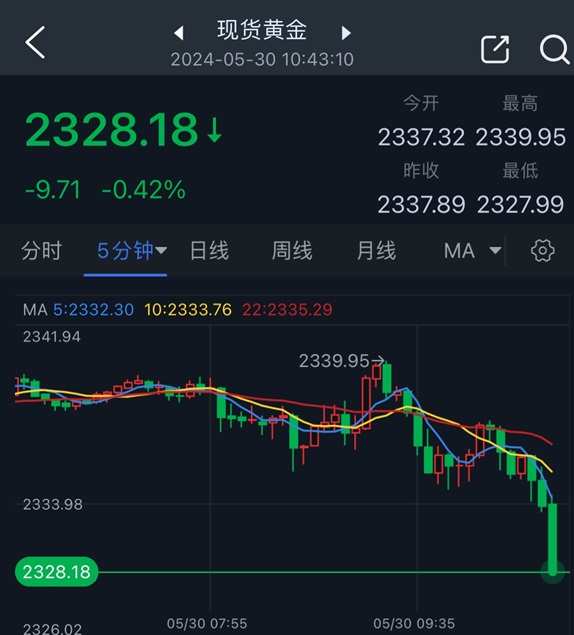
(5 minute chart of spot gold source: 24K99)
Bednarik pointed out that spot gold is under selling pressure. US Treasury yields soared to a one-month high, supporting demand for the dollar.
According to Bednarik, gold has gained downward traction and is approaching the support level of $2325.30 per ounce. Once it falls below this level, the gold price may decline even more sharply in the future.
Spot gold closed down $23.38, or 0.99%, to $2337.89 per ounce on Wednesday.
On Wednesday, US Treasury yields rose for the second day in a row. The 10-year US Treasury yield rose 7.2 basis points to 4.614%, reaching a peak of 4.638%.
The US dollar index closed with a strong rise of nearly 0.5% at 105.14 on Wednesday. The US dollar index rose further to around 105.20 in the Asian intraday market on Thursday.
Analysis of short-term technical prospects for gold
Bednarik said that technical indicators on the daily chart indicate that the price of gold may continue to decline. The price of gold is falling below the 20-day simple moving average (SMA), while technical indicators have gained downward traction and are falling below the midline. Finally, the 100-day SMA and 200-day SMA continued to move upward, but were far below the current level of gold prices.
Bednarik added that according to the 4-hour gold chart, the outlook for gold prices will turn bearish in the short term, but continued decline seems unlikely. The price of gold is trading below all moving averages, and the 20-period SMA is near $2347.10 per ounce, forming a recent resistance level. At the same time, after crossing the midline and entering a negative zone, the technical indicators leveled off, limiting downside space.
Bednarik pointed out that last week, the gold price hit a low of 2325.30 US dollars/ounce, and the price of gold needs to fall below this level to confirm that it will fall more sharply in the future.
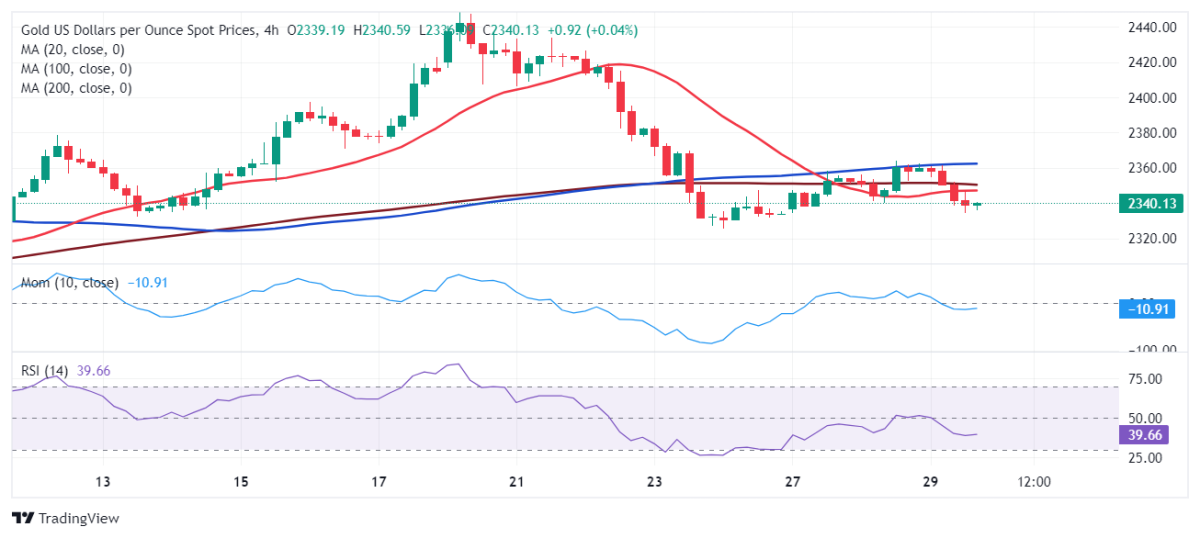
(Spot gold 4-hour chart source: FXStreet)
Bednarik gave the latest important support and resistance levels for gold prices:
Support levels: $2325.30/oz; $2307.10/oz
Resistance levels: $2347.10/oz; $2364.00/oz; $2372.90/oz
At 10:43 Beijing time, spot gold was reported at 2328.18 US dollars/ounce.