
Unfortunately for some shareholders, the Jin Medical International Ltd. (NASDAQ:ZJYL) share price has dived 30% in the last thirty days, prolonging recent pain. Nonetheless, the last 30 days have barely left a scratch on the stock's annual performance, which is up a whopping 861%.
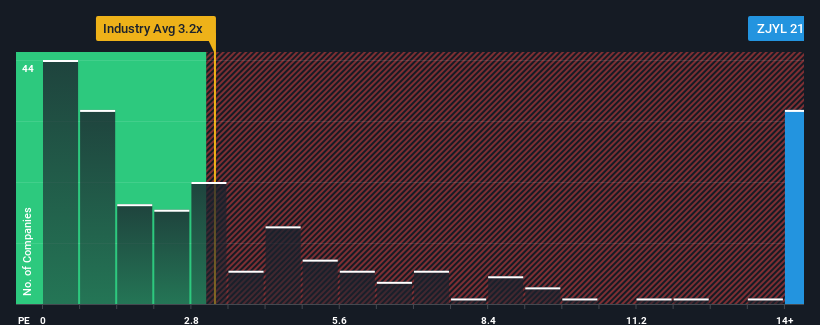
Although its price has dipped substantially, you could still be forgiven for thinking Jin Medical International is a stock to steer clear of with a price-to-sales ratios (or "P/S") of 21.6x, considering almost half the companies in the United States' Medical Equipment industry have P/S ratios below 3.2x. However, the P/S might be quite high for a reason and it requires further investigation to determine if it's justified.
What Does Jin Medical International's Recent Performance Look Like?
Revenue has risen at a steady rate over the last year for Jin Medical International, which is generally not a bad outcome. One possibility is that the P/S ratio is high because investors think this good revenue growth will be enough to outperform the broader industry in the near future. If not, then existing shareholders may be a little nervous about the viability of the share price.
We don't have analyst forecasts, but you can see how recent trends are setting up the company for the future by checking out our free report on Jin Medical International's earnings, revenue and cash flow.How Is Jin Medical International's Revenue Growth Trending?
The only time you'd be truly comfortable seeing a P/S as steep as Jin Medical International's is when the company's growth is on track to outshine the industry decidedly.
Taking a look back first, we see that the company managed to grow revenues by a handy 3.3% last year. The latest three year period has also seen a 22% overall rise in revenue, aided somewhat by its short-term performance. So we can start by confirming that the company has actually done a good job of growing revenue over that time.
This is in contrast to the rest of the industry, which is expected to grow by 9.6% over the next year, materially higher than the company's recent medium-term annualised growth rates.
With this information, we find it concerning that Jin Medical International is trading at a P/S higher than the industry. Apparently many investors in the company are way more bullish than recent times would indicate and aren't willing to let go of their stock at any price. There's a good chance existing shareholders are setting themselves up for future disappointment if the P/S falls to levels more in line with recent growth rates.
The Bottom Line On Jin Medical International's P/S
Even after such a strong price drop, Jin Medical International's P/S still exceeds the industry median significantly. It's argued the price-to-sales ratio is an inferior measure of value within certain industries, but it can be a powerful business sentiment indicator.
Our examination of Jin Medical International revealed its poor three-year revenue trends aren't detracting from the P/S as much as we though, given they look worse than current industry expectations. When we see slower than industry revenue growth but an elevated P/S, there's considerable risk of the share price declining, sending the P/S lower. Unless the recent medium-term conditions improve markedly, it's very challenging to accept these the share price as being reasonable.
Before you take the next step, you should know about the 2 warning signs for Jin Medical International that we have uncovered.
It's important to make sure you look for a great company, not just the first idea you come across. So if growing profitability aligns with your idea of a great company, take a peek at this free list of interesting companies with strong recent earnings growth (and a low P/E).
Have feedback on this article? Concerned about the content? Get in touch with us directly. Alternatively, email editorial-team (at) simplywallst.com.
This article by Simply Wall St is general in nature. We provide commentary based on historical data and analyst forecasts only using an unbiased methodology and our articles are not intended to be financial advice. It does not constitute a recommendation to buy or sell any stock, and does not take account of your objectives, or your financial situation. We aim to bring you long-term focused analysis driven by fundamental data. Note that our analysis may not factor in the latest price-sensitive company announcements or qualitative material. Simply Wall St has no position in any stocks mentioned.