
With its stock down 9.6% over the past three months, it is easy to disregard Safety Insurance Group (NASDAQ:SAFT). To decide if this trend could continue, we decided to look at its weak fundamentals as they shape the long-term market trends. Particularly, we will be paying attention to Safety Insurance Group's ROE today.
Return on equity or ROE is a key measure used to assess how efficiently a company's management is utilizing the company's capital. In simpler terms, it measures the profitability of a company in relation to shareholder's equity.
How Do You Calculate Return On Equity?
Return on equity can be calculated by using the formula:
Return on Equity = Net Profit (from continuing operations) ÷ Shareholders' Equity
So, based on the above formula, the ROE for Safety Insurance Group is:
6.4% = US$51m ÷ US$807m (Based on the trailing twelve months to March 2024).
The 'return' refers to a company's earnings over the last year. So, this means that for every $1 of its shareholder's investments, the company generates a profit of $0.06.
What Is The Relationship Between ROE And Earnings Growth?
So far, we've learned that ROE is a measure of a company's profitability. We now need to evaluate how much profit the company reinvests or "retains" for future growth which then gives us an idea about the growth potential of the company. Assuming everything else remains unchanged, the higher the ROE and profit retention, the higher the growth rate of a company compared to companies that don't necessarily bear these characteristics.
Safety Insurance Group's Earnings Growth And 6.4% ROE
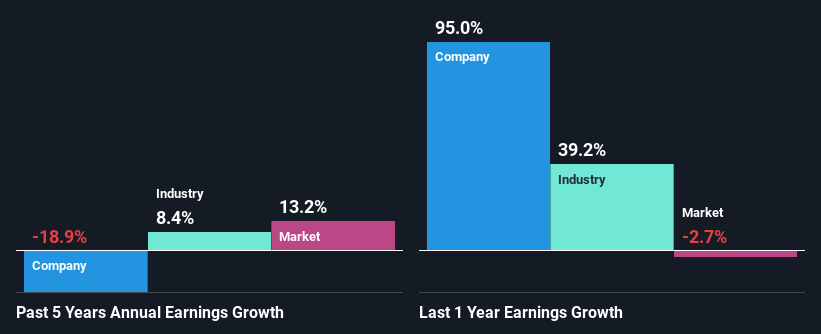
On the face of it, Safety Insurance Group's ROE is not much to talk about. Next, when compared to the average industry ROE of 13%, the company's ROE leaves us feeling even less enthusiastic. For this reason, Safety Insurance Group's five year net income decline of 19% is not surprising given its lower ROE. We believe that there also might be other aspects that are negatively influencing the company's earnings prospects. For example, it is possible that the business has allocated capital poorly or that the company has a very high payout ratio.
However, when we compared Safety Insurance Group's growth with the industry we found that while the company's earnings have been shrinking, the industry has seen an earnings growth of 8.4% in the same period. This is quite worrisome.
Earnings growth is an important metric to consider when valuing a stock. It's important for an investor to know whether the market has priced in the company's expected earnings growth (or decline). Doing so will help them establish if the stock's future looks promising or ominous. If you're wondering about Safety Insurance Group's's valuation, check out this gauge of its price-to-earnings ratio, as compared to its industry.
Is Safety Insurance Group Using Its Retained Earnings Effectively?
Safety Insurance Group's declining earnings is not surprising given how the company is spending most of its profits in paying dividends, judging by its three-year median payout ratio of 96% (or a retention ratio of 3.8%). With only a little being reinvested into the business, earnings growth would obviously be low or non-existent. You can see the 2 risks we have identified for Safety Insurance Group by visiting our risks dashboard for free on our platform here.
Moreover, Safety Insurance Group has been paying dividends for at least ten years or more suggesting that management must have perceived that the shareholders prefer dividends over earnings growth.
Summary
Overall, we would be extremely cautious before making any decision on Safety Insurance Group. Specifically, it has shown quite an unsatisfactory performance as far as earnings growth is concerned, and a poor ROE and an equally poor rate of reinvestment seem to be the reason behind this inadequate performance. Up till now, we've only made a short study of the company's growth data. To gain further insights into Safety Insurance Group's past profit growth, check out this visualization of past earnings, revenue and cash flows.
Have feedback on this article? Concerned about the content? Get in touch with us directly. Alternatively, email editorial-team (at) simplywallst.com.
This article by Simply Wall St is general in nature. We provide commentary based on historical data and analyst forecasts only using an unbiased methodology and our articles are not intended to be financial advice. It does not constitute a recommendation to buy or sell any stock, and does not take account of your objectives, or your financial situation. We aim to bring you long-term focused analysis driven by fundamental data. Note that our analysis may not factor in the latest price-sensitive company announcements or qualitative material. Simply Wall St has no position in any stocks mentioned.