
Source: Zhongjin Dim Sum
Author: Liu Gang, Zhang Weihan
CICC Research
Since mid-April, the Hong Kong stock market has closed higher for four consecutive weeks. The Hang Seng Index has accumulated a cumulative rebound of nearly 20% since the bottom, and once returned to around 19,600 points, a new high since August last year. According to our analysis in “Analysis of the Prospects after the Surge in Hong Kong Stocks”, the positive feedback self-realization brought about by the sudden and concentrated inflow of capital, combined with the previously sluggish turnover of the Hong Kong stock market, has jointly contributed to a surprisingly rapid rebound in the recent market. Combining various information and data, the main sources of funding are transactional funds and regionally allocated funds for some rebalancing needs, while EPFR data, which tracks the world's major long-term allocation funds, shows that capital continues to flow out of the Chinese market (“Momentum and Space for this round of rebound”).
The market is paying close attention to foreign investment trends, especially the behavior of leading institutions. In addition to EPFR data, quarterly position information disclosed by various institutions can provide more details. We sorted out the positions of the world's leading funds in the first quarter and found the following conclusions.
1Q24 trend: The size of positions continues to decline, but some institutions bucked the trend and increased their positions
The size of overseas asset management holdings has declined, and some institutions have increased their positions. 1) Overseas asset management institutions (active+passive) held a market value of US$604.1 billion in Chinese stocks in the first quarter, a slight decrease of US$7.4 billion (-1.2%) from the fourth quarter. This decline was less than the 2.2% decline in the MSCI China Index during the same period. 2) Looking further at active institutions, the market value of Chinese stocks held fell 1.6% to 434.7 billion US dollars (vs. 441.8 billion US dollars in the fourth quarter). The decline was also less than the decline in the index. The size of Chinese stock holdings of some leading institutions (such as Vanguard, Capital Group, FMR, etc.) even increased. 3) The holding ratio of Chinese stocks in the first quarter (Chinese stocks/total assets) was 1.2%, a slight decrease of 0.1 percentage points from the fourth quarter, and is still at its lowest level since 2016.
Looking at the subregion, the amount of Chinese shares held by US institutions remained the same as in the fourth quarter, and the holdings of Canadian and Australian institutions increased. Among the major regions, the US, the United Kingdom, and Hong Kong, China (excluding Chinese institutions) hold the largest number of Chinese stocks, accounting for 51%, 17%, and 16%, respectively. Compared to the fourth quarter, the market value of Chinese stocks held by US asset management institutions remained flat at US$306.3 billion, accounting for 0.8%, down slightly from 0.9% in the fourth quarter. The market value of institutional holdings in Hong Kong, China (excluding Chinese institutions) fell 4.5% to US$98.7 billion, and its share fell from 37.2% to 32.7%, the lowest level since 2018. The market value of UK holdings fell slightly by 0.8% to US$105.1 billion, and the share of holdings fell from 2.3% to 2.1% (an average of 3.5% since 2018, currently the lowest level since this period). In contrast, although institutions from countries such as Canada and Australia did not have a high holding scale (accounting for about 1-2%), their holdings increased, rising 3.9% and 3.6% month-on-month. Considering that the market index fell 2.2% during the same period, it may have shown some active position increase behavior.
Chart 1: The amount of Chinese shares held by foreign management institutions in the first quarter was about US$604.1 billion, a slight decrease of 1.2% over the previous quarter
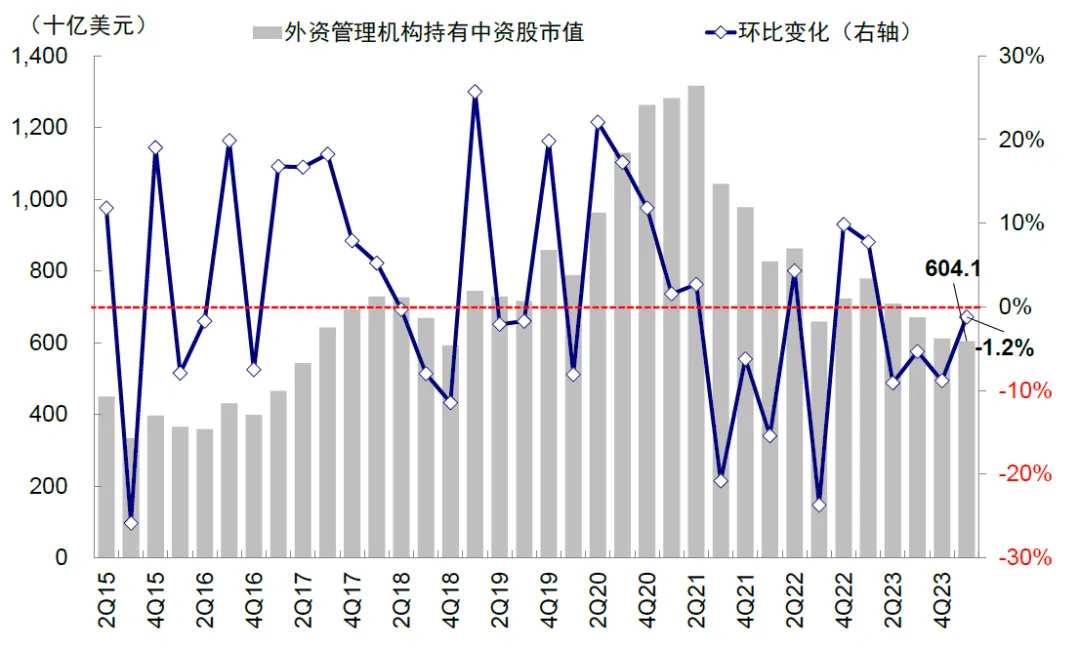
Chart 2: The amount of Chinese shares held by foreign-funded active management institutions fell back to US$434.7 billion in the first quarter, a slight decrease of 0.2% from the previous quarter
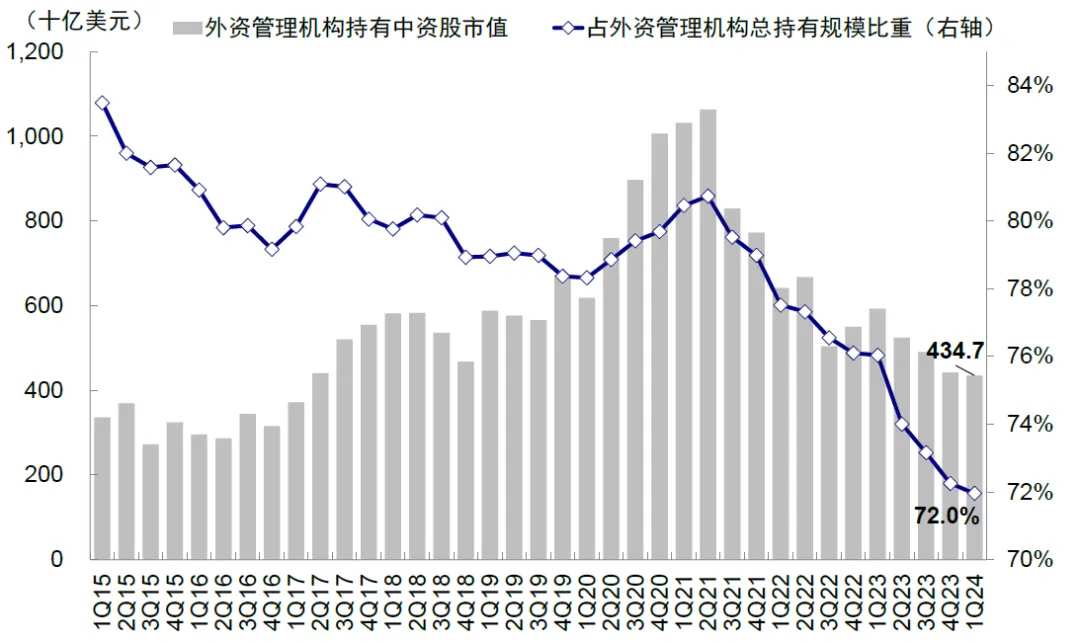
Chart 3: A total of 2,195 foreign-funded management institutions allocated the Chinese stock market in the first quarter, a slight decrease compared to 2,223 in the fourth quarter of this year

Chart 4: Foreign management agencies allocated 1.2% of Chinese shares in the first quarter, down 0.1 percentage points from the fourth quarter

Chart 5: The ratio of US asset management institutions' holdings to total foreign holdings increased in the first quarter compared to the fourth quarter, but there was a marked decline in Hong Kong, China

Chart 6: The ratio of asset management institutions in the US, Canada, Japan and other countries in the first quarter was basically close to or at a new low since 2015

Chart 7: As of 4Q23, foreign asset management institutions in the US, the United Kingdom, and Hong Kong, China held a high number of Chinese shares in major countries and regions, at 51%, 17%, and 16%, respectively


Chart 8: The size of Chinese shares held by the top 20 foreign management agencies (parent companies) in the fourth quarter accounted for 61.1% of all foreign Chinese stock holdings

Position structure: Increased holdings of Hong Kong stocks, but reduced holdings of A shares; increased holdings required for consumer and telecommunication services, but commercial professional services and insurance holdings were reduced more
Focusing on the top 20 active management institutions holding Chinese stocks (accounting for 22.7% of the total size), they held US$137.1 billion in Chinese stocks in the first quarter, down 2.7% from US$140.8 billion in the fourth quarter. Further analyzing its position holding behavior, the following findings were made.
► Reduced A-share holdings and mid-term holdings, but increased Hong Kong stock holdings. The market values of A shares held by the above institutions in 1Q23, Hong Kong stocks, and CCP shares decreased by 1.2%, 2.0% and 9.0%, respectively. Excluding price factors (constant price in 1Q24 × change in number of shares held), we estimate that the positions of the leading institutions mentioned above in A-shares and CCP shares decreased by 1.8% and 7.8%, respectively, but increased their holdings in Hong Kong stocks by about 2.5% month-on-month. Despite the increase in Hong Kong stocks in the first quarter, Hong Kong stocks currently account for about 2.2% of the total assets of the 20 institutions mentioned above, which is still significantly lower than the 3.2% average since 2020.
Looking at the overall ratio of Chinese stocks held by the above institutions in various markets, Hong Kong stocks and A shares accounted for 55.6% and 26.3% of all Chinese stocks held by foreign investors in the first quarter, which is higher than the average values of 51.6% and 25.4% respectively since 2020. However, China Securities accounted for 18.2%, which is significantly lower than its average of 23.0% since 2020.
► Industry preferences: reducing holdings in commercial and professional services, insurance, software and services, etc.; consumption of essential goods, telecommunication services, consumer services, etc. Excluding price factors, we estimate that leading asset management institutions reduced their holdings in commercial and professional services (mainly related to environmental protection, office services, etc., -14%), insurance (-8%), software and services (-8%), and household and personal goods (-6%), but increased their holdings in essential retail (+10%), telecommunications services (+6%), consumer services (+4%), and transportation (+4%). In terms of allocation level, foreign-owned media and entertainment (20.4%), optional retail (13.9%), consumer services (12.0%), and capital goods (6.7%) account for the highest share; in comparison, telecommunications services (0.2%), commercial and professional services (0.2%), and household and personal goods (0.4%) account for the lowest share.
► Heavy stocks: The top 20 largest stocks were added by 7; Meituan, Tencent, etc. increased their holdings, while Yum China and Ali reduced their holdings the most. In the first quarter, the top 20 largest Chinese stocks held by the leading asset management institutions mentioned above totaled 121, a decrease of 1 compared to 4Q23. Specifically, there are 9 new entrants to the top 20 major stocks of the above institutions, namely BOSS Direct Recruitment, Fanzhong Media, Xinyi Solar, China Hongqiao, Lucky Coffee, Huazhu, Donga Ejiao, Qiaqia Foods, and Haitian International. In contrast, 10 companies that were in the top 20 largest stocks in the fourth quarter failed to make the list. They were Dongfang Wealth, Siyuan Electric, Hanson Pharmaceuticals, Ganfeng Lithium, Longhu Group, Vail Co., Ltd., China Tower, BYD Electronics, Hang Seng Electronics, and Guangzhou Lianda. In terms of individual stocks, Meituan, Tencent, Ctrip, and Anta have increased their holdings the most; however, Yum China, Alibaba, NIO, and China Financial Insurance have reduced their holdings the most.
Chart 9: In the first quarter, the positions of leading foreign active institutions in A-shares and Chinese securities decreased by 1.8% and 7.8% month-on-month, respectively, but increased by 2.5% against Hong Kong stocks

Chart 10: In terms of allocation ratio, Hong Kong stocks and A shares accounted for 56% and 26% of the total Chinese shares held by foreign investors in the first quarter, respectively

Chart 11: In the first quarter, foreign investors mainly reduced their holdings in finance, healthcare, etc., and increased their holdings in communication services and raw materials

Chart 12: In industry segments, holdings were mainly reduced in commercial and professional services, insurance, etc., and retail and telecommunication services for essential goods were added

Chart 13: Foreign capital was allocated a high proportion of the optional consumer and communication services sector in the fourth quarter

Chart 14: More segmented, media and entertainment, e-commerce retail, consumer services, and food and beverage are the highest

Chart 15: Status of Chinese stocks held by leading active foreign management institutions in 1Q24

Chart 16: Status of Chinese stocks held by leading active foreign management institutions in 4Q23

Chart 17: After excluding changes in stock price factors, leading active foreign management agencies added/reduced allocations of individual shares in 1Q24

Outlook: Short-term foreign capital inflows drive a rapid rebound in the market, but continued return over the long term still needs to be supported by fundamentals
Recently, the Hong Kong stock market has risen rapidly. According to our estimates, current funding sources are mainly transactional funds and regional allocations that require partial rebalancing, such as some hedge funds that act faster or trading funds to make up for short positions (the current share of short sales in the Hong Kong stock market plummeted by 6ppt to 14% within a month, the lowest since January 2024), and the rebalancing of local and regional allocations back to the market due to further fluctuations in external markets such as Japan. As of March of this year, the overall allocation ratio of various active funds around the world (including investment covering emerging markets, Asia excluding Japan, global markets, etc.) to Chinese stocks has dropped from a high of 15% in October 2020 to 5%, which is 1ppt lower than passive funds. Furthermore, as of the first quarter of this year, although some hedge funds increased their holdings in Chinese stocks, the overall positions of the world's leading hedge funds in Chinese stocks fell 9.3% month-on-month, exceeding the 2.2% decline in the MSCI China Index during the same period.
At the same time, the latest EPFR data shows that more regional foreign capital is flowing into overseas Chinese stock markets, including mainly investing in China, Greater China, emerging markets, and global funds other than the US, especially passive capital inflows of 170 million US dollars. However, overseas active capital outflows have expanded, and it is not ruled out that there will be a certain profit return. We estimate that if active foreign capital outflows from the first quarter of this year are used as an approximation of some regional capital rebalancing requirements, then the inflow scale in the first phase under the EPFR scale may be about 5 billion US dollars, which is equivalent to about one-quarter of the total active foreign capital outflows since 2023. If we further assume that all active foreign capital mentioned above will shift from low allocations to standard Chinese stocks, it is expected to bring in more than 45 billion US dollars in inflows, close to the total amount of outflows from the Chinese market since late 2021. However, this assumption is that the reallocation of medium- to long-term capital requires significant improvements in fundamentals to cooperate. In particular, fiscal policy is strengthened to deal with the current problems of declining inflation and credit contraction. We believe that the recent “combo punch” of policies, including real estate and ultra-long-term treasury bonds, has boosted expectations in the short term, but if policies are to be effective, especially if they want to reflect fundamentals, compared to long-term goals, the overall strength and speed of progress of policies is particularly critical. This is also our main observation factor in judging the subsequent inflow of foreign capital and market trends (“Momentum and Space for the Current Round of Rebound”).
Chart 18: Under the EPFR scale, overseas active capital has recently continued the trend of outflows from overseas Chinese stocks since March last year

Chart 19: This outflow continues in the A-share market

Chart 20: If all outflows since the first quarter were returned, it would correspond to US$4.9 billion, equivalent to 26% of the outflow since 2023

Chart 21: If the allocation ratio of various types of global funds to the Chinese market returns to standard, it will bring in an inflow of 45 billion US dollars

Chart 22: Looking at the structure of Chinese stocks held by foreign investors, value capital (public long-only, etc.) clearly dominates (60-80%)

Chart 23: As of the end of the first quarter, the world's major hedge funds' Chinese stock holdings fell 9.3%

Chart 24: Recent return of regionally allocated funds for some rebalancing needs, mainly passive funds

Chart 25: Judging from historical experience, active value foreign investment is greatly influenced by fundamentals, so it is naturally an indicator that the market and fundamentals are synchronized or even lagging behind

Editor/jayden