
#黄金技术分析 #24K99讯 In the Asian market on Thursday (May 23), spot gold suddenly plummeted in the short term. The price of gold fell sharply from a high of 2383.75 US dollars/ounce during the period, and just hit a low of 2366.70 US dollars/ounce, setting an intraday low. FXStreet chief analyst Valeria Bednarik wrote an article analyzing the technical prospects of gold.
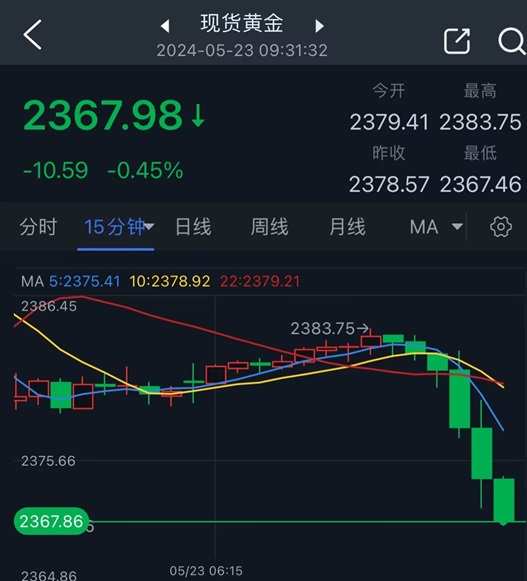
(15 minute spot gold chart source: 24K99)
Bednarik pointed out that gold has already plummeted, and it seems that the price of gold will continue to decline.
On Wednesday, the price of gold fell sharply due to hawkish language in the minutes of the US Federal Open Market Committee (FOMC) meeting, which dampened hopes of cutting interest rates.
Spot gold closed down $42.10, or 1.74%, to $2378.57 per ounce on Wednesday. The price of gold hit an intraday low of $2374.90 per ounce.
The Federal Reserve released the minutes of the April 30 to May 1 monetary policy meeting on Wednesday. The minutes showed that Fed officials were increasingly concerned about inflation at recent meetings. Members said they lacked confidence to push forward interest rate cuts.
Monetary policy makers agree that recent first-quarter inflation data and signs of strong economic momentum are disappointing, indicating “it will take longer than previously anticipated to gain greater confidence” and believe that inflation is steadily returning to the 2% target.
Federal Reserve officials discussed the need to keep interest rates stable for a longer period of time, or lower interest rates when the labor market weakens, while “many” participating officials also mentioned that they are willing to raise interest rates if necessary.
Analysis of short-term technical prospects for gold
Bednarik said that the price of gold has fallen below the 2,400 US dollars/ounce mark. Technical data on the daily chart supports the continuation of the ongoing corrective decline in gold prices. The indicator has fallen sharply from data close to overbought, maintaining a firm bearish trend.
Notably, the price of gold has fallen below the bearish target and the key support level of $2,370 per ounce.
Bednarik added that in the short term, according to the 4-hour chart, the risk of gold price trends tends to decline. The price of gold continued its decline below the 20-period SMA, and the moving average provided resistance in the $2,420 per ounce area. Furthermore, technical indicators are almost vertically downward, at negative levels, in line with continued sell-off interest.
As the price of gold falls below Wednesday's low, it could trigger a new round of strong sell-off.
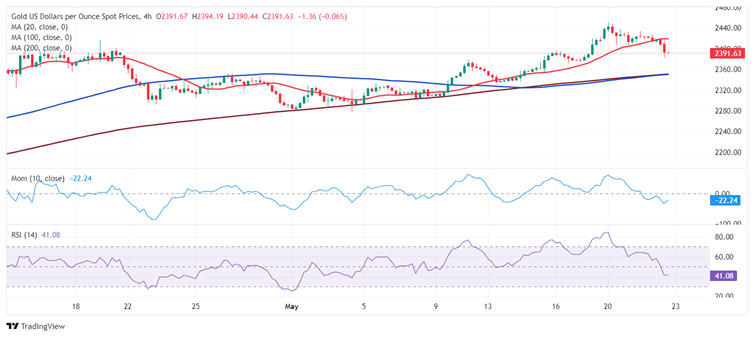
(Spot gold 4-hour chart source: FXStreet)
Bednarik gave the latest important support and resistance levels for gold prices:
Support level: $2357.20 per ounce
Resistance levels: $2404.60/oz; $2419.30/oz; $2431.35/oz
At 09:31 Beijing time, spot gold was reported at 2367.98 US dollars/ounce.