
Warren Buffett famously said, 'Volatility is far from synonymous with risk.' It's only natural to consider a company's balance sheet when you examine how risky it is, since debt is often involved when a business collapses. Importantly, SATS Ltd. (SGX:S58) does carry debt. But should shareholders be worried about its use of debt?
Why Does Debt Bring Risk?
Generally speaking, debt only becomes a real problem when a company can't easily pay it off, either by raising capital or with its own cash flow. In the worst case scenario, a company can go bankrupt if it cannot pay its creditors. However, a more usual (but still expensive) situation is where a company must dilute shareholders at a cheap share price simply to get debt under control. Of course, the upside of debt is that it often represents cheap capital, especially when it replaces dilution in a company with the ability to reinvest at high rates of return. When we think about a company's use of debt, we first look at cash and debt together.
What Is SATS's Debt?
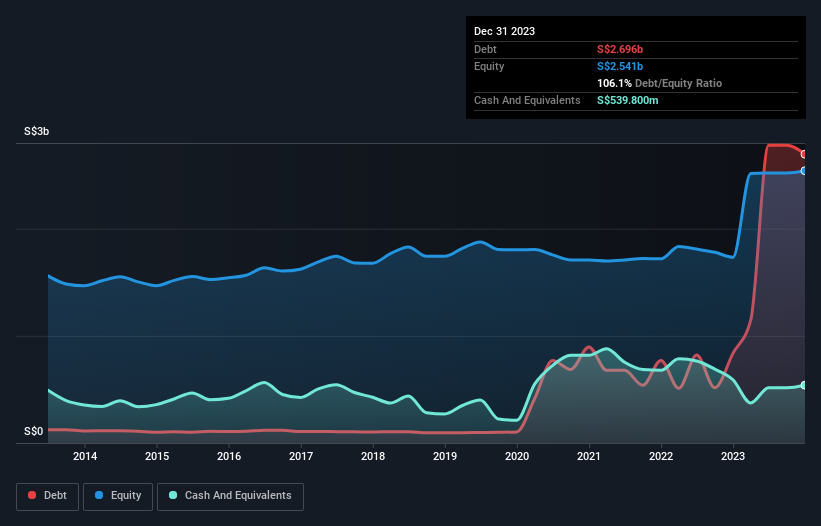
As you can see below, at the end of December 2023, SATS had S$2.70b of debt, up from S$836.9m a year ago. Click the image for more detail. However, because it has a cash reserve of S$539.8m, its net debt is less, at about S$2.16b.
How Healthy Is SATS' Balance Sheet?
Zooming in on the latest balance sheet data, we can see that SATS had liabilities of S$3.33b due within 12 months and liabilities of S$2.70b due beyond that. On the other hand, it had cash of S$539.8m and S$1.15b worth of receivables due within a year. So its liabilities outweigh the sum of its cash and (near-term) receivables by S$4.33b.
When you consider that this deficiency exceeds the company's S$3.79b market capitalization, you might well be inclined to review the balance sheet intently. Hypothetically, extremely heavy dilution would be required if the company were forced to pay down its liabilities by raising capital at the current share price.
We measure a company's debt load relative to its earnings power by looking at its net debt divided by its earnings before interest, tax, depreciation, and amortization (EBITDA) and by calculating how easily its earnings before interest and tax (EBIT) cover its interest expense (interest cover). The advantage of this approach is that we take into account both the absolute quantum of debt (with net debt to EBITDA) and the actual interest expenses associated with that debt (with its interest cover ratio).
While SATS's debt to EBITDA ratio (3.8) suggests that it uses some debt, its interest cover is very weak, at 1.5, suggesting high leverage. It seems that the business incurs large depreciation and amortisation charges, so maybe its debt load is heavier than it would first appear, since EBITDA is arguably a generous measure of earnings. So shareholders should probably be aware that interest expenses appear to have really impacted the business lately. However, the silver lining was that SATS achieved a positive EBIT of S$173m in the last twelve months, an improvement on the prior year's loss. There's no doubt that we learn most about debt from the balance sheet. But ultimately the future profitability of the business will decide if SATS can strengthen its balance sheet over time. So if you're focused on the future you can check out this free report showing analyst profit forecasts.
Finally, a business needs free cash flow to pay off debt; accounting profits just don't cut it. So it's worth checking how much of the earnings before interest and tax (EBIT) is backed by free cash flow. Happily for any shareholders, SATS actually produced more free cash flow than EBIT over the last year. That sort of strong cash generation warms our hearts like a puppy in a bumblebee suit.
Our View
Neither SATS's ability to cover its interest expense with its EBIT nor its level of total liabilities gave us confidence in its ability to take on more debt. But its conversion of EBIT to free cash flow tells a very different story, and suggests some resilience. We should also note that Infrastructure industry companies like SATS commonly do use debt without problems. When we consider all the factors discussed, it seems to us that SATS is taking some risks with its use of debt. So while that leverage does boost returns on equity, we wouldn't really want to see it increase from here. The balance sheet is clearly the area to focus on when you are analysing debt. But ultimately, every company can contain risks that exist outside of the balance sheet. For example, we've discovered 2 warning signs for SATS (1 is significant!) that you should be aware of before investing here.
At the end of the day, it's often better to focus on companies that are free from net debt. You can access our special list of such companies (all with a track record of profit growth). It's free.
Have feedback on this article? Concerned about the content? Get in touch with us directly. Alternatively, email editorial-team (at) simplywallst.com.
This article by Simply Wall St is general in nature. We provide commentary based on historical data and analyst forecasts only using an unbiased methodology and our articles are not intended to be financial advice. It does not constitute a recommendation to buy or sell any stock, and does not take account of your objectives, or your financial situation. We aim to bring you long-term focused analysis driven by fundamental data. Note that our analysis may not factor in the latest price-sensitive company announcements or qualitative material. Simply Wall St has no position in any stocks mentioned.