
#黄金技术分析 #24K99讯 In the Asian market on Wednesday (May 22), spot gold suddenly rose rapidly in the short term. The price of gold broke through 2,426 US dollars/ounce, setting a new intraday high. FXStreet chief analyst Valeria Bednarik wrote an article analyzing the technical prospects of gold.

(5 minute chart of spot gold source: 24K99)
Bednarik noted that spot gold was under mild selling pressure on Tuesday. The focus now shifts to the FOMC meeting minutes scheduled to be released on Wednesday. Market participants want to be clear about the timing of a shift in monetary policy, and policymakers have so far declined to provide this.
Spot gold closed down $5.22, or 0.22%, to $2420.67 per ounce on Tuesday. Gold prices hit an intraday low of $2406.04 per ounce.
At 02:00 Beijing time on Thursday, the US Federal Open Market Committee (FOMC) will release the minutes of the monetary policy meeting from the end of April to the beginning of May.
Monex USA forex trader Helen Given said, “The statements of the Federal Reserve officials are driving the market, but as of now, they have not made any statements beyond what traders expected. Unless Wednesday's FOMC minutes are unexpected, the market is likely to be pretty quiet this week.”
Analysis of short-term technical prospects for gold
Bednarik said that from a technical perspective, the price of gold remained near the record high set on Monday and lost its bullish momentum, but it is far from turning bearish. The daily chart shows that the price of gold is still far above the slightly bullish 20-day simple moving average (SMA), which is currently around $2,345 per ounce. The longer-term moving average maintained a bullish trend below the 20-day SMA. Technical indicators have declined from near overbought readings, but there is no actual bearish strength.
Bednarik added that technical data on the 4-hour chart shows that the price of gold may be under moderate pressure in the short term. Technical indicators continue to fall within positive levels, but the bullish 20-period SMA provides support. Currently, the EMA is around $2408.40 per ounce. Finally, the 100-period SMA and 200-period SMA maintained a moderate upward trend at levels over $100 below the current price.
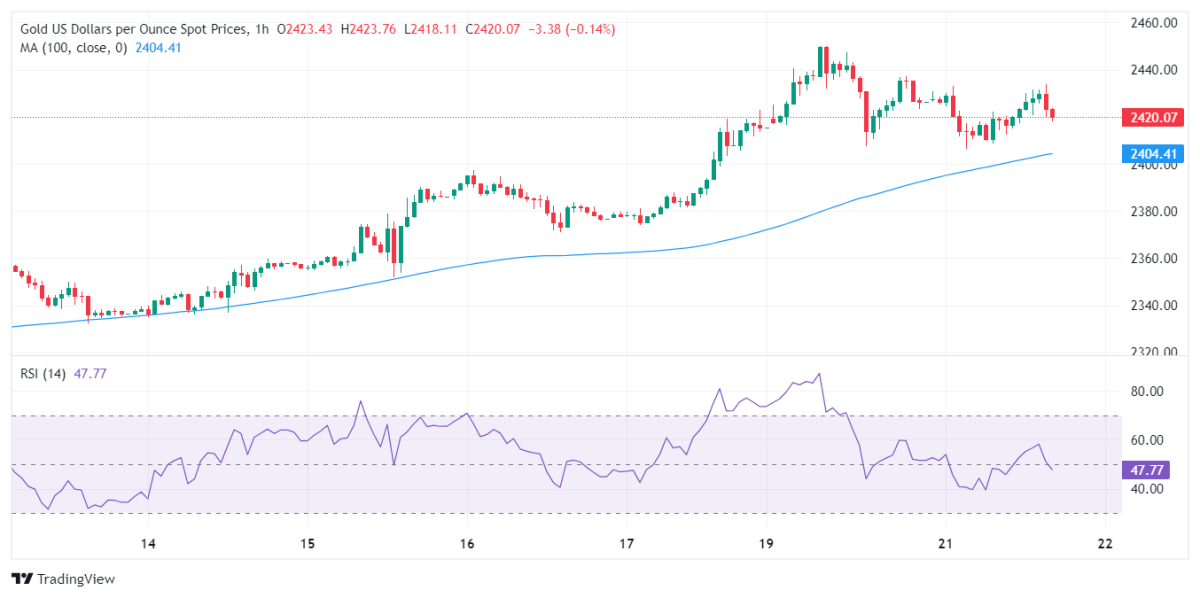
(Spot gold 4-hour chart source: FXStreet)
Bednarik gave the latest important support and resistance levels for gold prices:
Support levels: $2406.50 per ounce; $2393.20 per ounce; $2375.10 per ounce
Resistance levels: $2431.90/oz; $2450.00/oz; $2465.00/oz
At 10:12 Beijing time, spot gold was reported at 2426.27 US dollars/ounce.