
The Suzhou Kelida Building& Decoration Co.,Ltd. (SHSE:603828) share price has fared very poorly over the last month, falling by a substantial 27%. Instead of being rewarded, shareholders who have already held through the last twelve months are now sitting on a 44% share price drop.
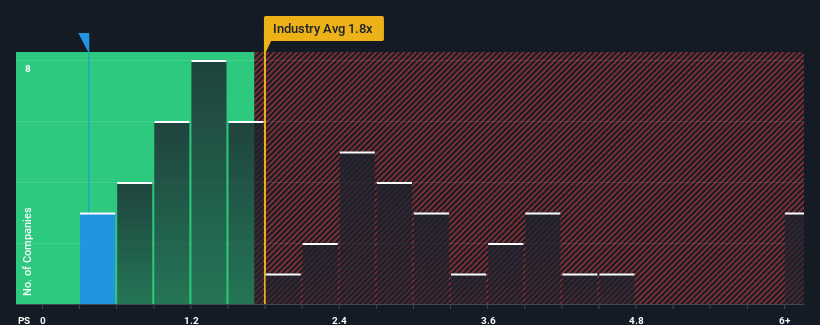
Since its price has dipped substantially, considering around half the companies operating in China's Building industry have price-to-sales ratios (or "P/S") above 1.8x, you may consider Suzhou Kelida Building& DecorationLtd as an solid investment opportunity with its 0.4x P/S ratio. However, the P/S might be low for a reason and it requires further investigation to determine if it's justified.
How Suzhou Kelida Building& DecorationLtd Has Been Performing
Suzhou Kelida Building& DecorationLtd certainly has been doing a great job lately as it's been growing its revenue at a really rapid pace. One possibility is that the P/S ratio is low because investors think this strong revenue growth might actually underperform the broader industry in the near future. Those who are bullish on Suzhou Kelida Building& DecorationLtd will be hoping that this isn't the case, so that they can pick up the stock at a lower valuation.
Although there are no analyst estimates available for Suzhou Kelida Building& DecorationLtd, take a look at this free data-rich visualisation to see how the company stacks up on earnings, revenue and cash flow.How Is Suzhou Kelida Building& DecorationLtd's Revenue Growth Trending?
In order to justify its P/S ratio, Suzhou Kelida Building& DecorationLtd would need to produce sluggish growth that's trailing the industry.
If we review the last year of revenue growth, the company posted a terrific increase of 40%. Still, revenue has fallen 3.0% in total from three years ago, which is quite disappointing. Therefore, it's fair to say the revenue growth recently has been undesirable for the company.
Weighing that medium-term revenue trajectory against the broader industry's one-year forecast for expansion of 18% shows it's an unpleasant look.
In light of this, it's understandable that Suzhou Kelida Building& DecorationLtd's P/S would sit below the majority of other companies. Nonetheless, there's no guarantee the P/S has reached a floor yet with revenue going in reverse. Even just maintaining these prices could be difficult to achieve as recent revenue trends are already weighing down the shares.
What Does Suzhou Kelida Building& DecorationLtd's P/S Mean For Investors?
The southerly movements of Suzhou Kelida Building& DecorationLtd's shares means its P/S is now sitting at a pretty low level. Typically, we'd caution against reading too much into price-to-sales ratios when settling on investment decisions, though it can reveal plenty about what other market participants think about the company.
As we suspected, our examination of Suzhou Kelida Building& DecorationLtd revealed its shrinking revenue over the medium-term is contributing to its low P/S, given the industry is set to grow. At this stage investors feel the potential for an improvement in revenue isn't great enough to justify a higher P/S ratio. Given the current circumstances, it seems unlikely that the share price will experience any significant movement in either direction in the near future if recent medium-term revenue trends persist.
You need to take note of risks, for example - Suzhou Kelida Building& DecorationLtd has 2 warning signs (and 1 which is a bit unpleasant) we think you should know about.
If you're unsure about the strength of Suzhou Kelida Building& DecorationLtd's business, why not explore our interactive list of stocks with solid business fundamentals for some other companies you may have missed.
Have feedback on this article? Concerned about the content? Get in touch with us directly. Alternatively, email editorial-team (at) simplywallst.com.
This article by Simply Wall St is general in nature. We provide commentary based on historical data and analyst forecasts only using an unbiased methodology and our articles are not intended to be financial advice. It does not constitute a recommendation to buy or sell any stock, and does not take account of your objectives, or your financial situation. We aim to bring you long-term focused analysis driven by fundamental data. Note that our analysis may not factor in the latest price-sensitive company announcements or qualitative material. Simply Wall St has no position in any stocks mentioned.