
Despite an already strong run, DaTang HuaYin Electric Power CO.,LTD (SHSE:600744) shares have been powering on, with a gain of 30% in the last thirty days. The bad news is that even after the stocks recovery in the last 30 days, shareholders are still underwater by about 6.0% over the last year.
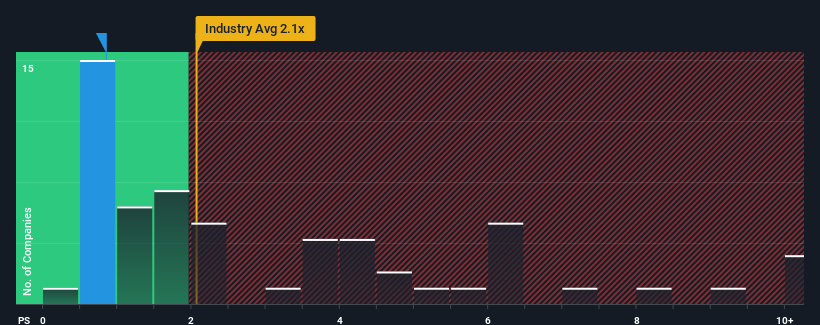
Although its price has surged higher, DaTang HuaYin Electric PowerLTD may still be sending bullish signals at the moment with its price-to-sales (or "P/S") ratio of 0.8x, since almost half of all companies in the Renewable Energy industry in China have P/S ratios greater than 2.1x and even P/S higher than 5x are not unusual. Although, it's not wise to just take the P/S at face value as there may be an explanation why it's limited.
What Does DaTang HuaYin Electric PowerLTD's P/S Mean For Shareholders?
For instance, DaTang HuaYin Electric PowerLTD's receding revenue in recent times would have to be some food for thought. Perhaps the market believes the recent revenue performance isn't good enough to keep up the industry, causing the P/S ratio to suffer. Those who are bullish on DaTang HuaYin Electric PowerLTD will be hoping that this isn't the case so that they can pick up the stock at a lower valuation.
Although there are no analyst estimates available for DaTang HuaYin Electric PowerLTD, take a look at this free data-rich visualisation to see how the company stacks up on earnings, revenue and cash flow.Is There Any Revenue Growth Forecasted For DaTang HuaYin Electric PowerLTD?
DaTang HuaYin Electric PowerLTD's P/S ratio would be typical for a company that's only expected to deliver limited growth, and importantly, perform worse than the industry.
Retrospectively, the last year delivered a frustrating 4.6% decrease to the company's top line. That put a dampener on the good run it was having over the longer-term as its three-year revenue growth is still a noteworthy 9.0% in total. So we can start by confirming that the company has generally done a good job of growing revenue over that time, even though it had some hiccups along the way.
Comparing the recent medium-term revenue trends against the industry's one-year growth forecast of 12% shows it's noticeably less attractive.
In light of this, it's understandable that DaTang HuaYin Electric PowerLTD's P/S sits below the majority of other companies. It seems most investors are expecting to see the recent limited growth rates continue into the future and are only willing to pay a reduced amount for the stock.
The Key Takeaway
The latest share price surge wasn't enough to lift DaTang HuaYin Electric PowerLTD's P/S close to the industry median. Typically, we'd caution against reading too much into price-to-sales ratios when settling on investment decisions, though it can reveal plenty about what other market participants think about the company.
Our examination of DaTang HuaYin Electric PowerLTD confirms that the company's revenue trends over the past three-year years are a key factor in its low price-to-sales ratio, as we suspected, given they fall short of current industry expectations. At this stage investors feel the potential for an improvement in revenue isn't great enough to justify a higher P/S ratio. If recent medium-term revenue trends continue, it's hard to see the share price experience a reversal of fortunes anytime soon.
Having said that, be aware DaTang HuaYin Electric PowerLTD is showing 2 warning signs in our investment analysis, you should know about.
Of course, profitable companies with a history of great earnings growth are generally safer bets. So you may wish to see this free collection of other companies that have reasonable P/E ratios and have grown earnings strongly.
Have feedback on this article? Concerned about the content? Get in touch with us directly. Alternatively, email editorial-team (at) simplywallst.com.
This article by Simply Wall St is general in nature. We provide commentary based on historical data and analyst forecasts only using an unbiased methodology and our articles are not intended to be financial advice. It does not constitute a recommendation to buy or sell any stock, and does not take account of your objectives, or your financial situation. We aim to bring you long-term focused analysis driven by fundamental data. Note that our analysis may not factor in the latest price-sensitive company announcements or qualitative material. Simply Wall St has no position in any stocks mentioned.