
Fiserv's (NYSE:FI) 12% CAGR Outpaced the Company's Earnings Growth Over the Same Five-year Period
Fiserv's (NYSE:FI) 12% CAGR Outpaced the Company's Earnings Growth Over the Same Five-year Period
These days it's easy to simply buy an index fund, and your returns should (roughly) match the market. But in our experience, buying the right stocks can give your wealth a significant boost. For example, the Fiserv, Inc. (NYSE:FI) share price is up 77% in the last five years, slightly above the market return. It's fair to say the stock has continued its long term trend in the last year, over which it has risen 29%.
如今,簡單地購買指數基金很容易,而且您的回報應該(大致地)與市場相匹配。但是根據我們的經驗,購買合適的股票可以顯著增加您的財富。例如,Fiserv, Inc.(紐約證券交易所代碼:FI)的股價在過去五年中上漲了77%,略高於市場回報率。可以公平地說,該股在去年延續了長期走勢,上漲了29%。
Since it's been a strong week for Fiserv shareholders, let's have a look at trend of the longer term fundamentals.
由於對Fiserv股東來說,這是強勁的一週,讓我們來看看長期基本面的趨勢。
In his essay The Superinvestors of Graham-and-Doddsville Warren Buffett described how share prices do not always rationally reflect the value of a business. One way to examine how market sentiment has changed over time is to look at the interaction between a company's share price and its earnings per share (EPS).
在他的文章中 格雷厄姆和多茲維爾的超級投資者 禾倫·巴菲特描述了股價如何並不總是合理地反映企業的價值。研究市場情緒如何隨着時間的推移而變化的一種方法是研究公司股價與其每股收益(EPS)之間的相互作用。
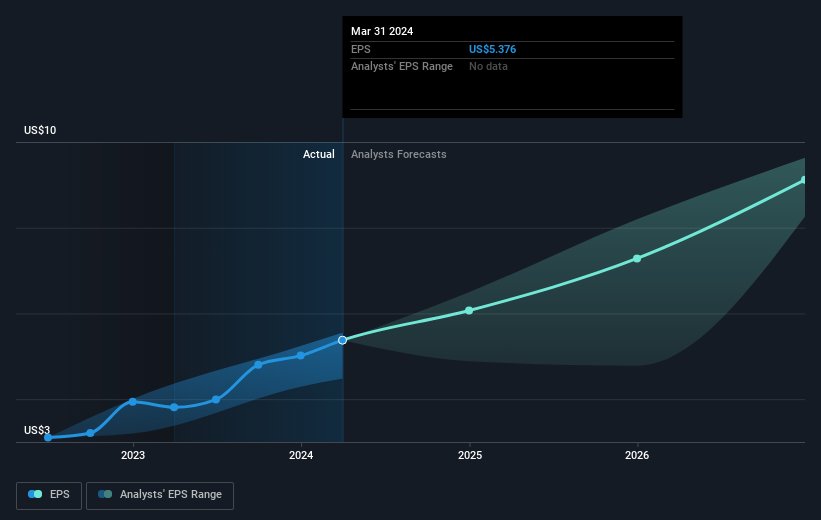
During five years of share price growth, Fiserv achieved compound earnings per share (EPS) growth of 18% per year. This EPS growth is higher than the 12% average annual increase in the share price. Therefore, it seems the market has become relatively pessimistic about the company.
在五年的股價增長中,Fiserv實現了每年18%的複合每股收益(EPS)增長。每股收益的增長高於股價平均年增長12%。因此,市場似乎對該公司變得相對悲觀。
The company's earnings per share (over time) is depicted in the image below (click to see the exact numbers).
該公司的每股收益(隨着時間的推移)如下圖所示(點擊查看確切數字)。
We know that Fiserv has improved its bottom line over the last three years, but what does the future have in store? You can see how its balance sheet has strengthened (or weakened) over time in this free interactive graphic.
我們知道Fiserv在過去三年中提高了利潤,但是未來會發生什麼?您可以在這張免費的交互式圖片中看到其資產負債表如何隨着時間的推移而增強(或減弱)。
A Different Perspective
不同的視角
Fiserv provided a TSR of 29% over the year. That's fairly close to the broader market return. That gain looks pretty satisfying, and it is even better than the five-year TSR of 12% per year. It is possible that management foresight will bring growth well into the future, even if the share price slows down. I find it very interesting to look at share price over the long term as a proxy for business performance. But to truly gain insight, we need to consider other information, too. Consider for instance, the ever-present spectre of investment risk. We've identified 1 warning sign with Fiserv , and understanding them should be part of your investment process.
Fiserv全年股東總回報率爲29%。這與更廣泛的市場回報率相當接近。這種增長看起來相當令人滿意,甚至比每年12%的五年期股東總回報率還要好。即使股價放緩,管理層的遠見也有可能爲未來帶來增長。我發現將長期股價視爲業務績效的代表非常有趣。但是,要真正獲得見解,我們還需要考慮其他信息。例如,投資風險的幽靈無處不在。我們已經在Fiserv上發現了一個警告信號,了解它們應該是您投資過程的一部分。
Of course Fiserv may not be the best stock to buy. So you may wish to see this free collection of growth stocks.
當然,Fiserv可能不是最值得購買的股票。因此,您可能希望看到這批免費的成長股。
Please note, the market returns quoted in this article reflect the market weighted average returns of stocks that currently trade on American exchanges.
請注意,本文引用的市場回報反映了目前在美國交易所交易的股票的市場加權平均回報。
Have feedback on this article? Concerned about the content? Get in touch with us directly. Alternatively, email editorial-team (at) simplywallst.com.
This article by Simply Wall St is general in nature. We provide commentary based on historical data and analyst forecasts only using an unbiased methodology and our articles are not intended to be financial advice. It does not constitute a recommendation to buy or sell any stock, and does not take account of your objectives, or your financial situation. We aim to bring you long-term focused analysis driven by fundamental data. Note that our analysis may not factor in the latest price-sensitive company announcements or qualitative material. Simply Wall St has no position in any stocks mentioned.
對這篇文章有反饋嗎?對內容感到擔憂?直接聯繫我們。 或者,給編輯團隊 (at) simplywallst.com 發送電子郵件。
Simply Wall St的這篇文章本質上是籠統的。我們僅使用公正的方法根據歷史數據和分析師的預測提供評論,我們的文章無意作爲財務建議。它不構成買入或賣出任何股票的建議,也沒有考慮到您的目標或財務狀況。我們的目標是爲您提供由基本數據驅動的長期重點分析。請注意,我們的分析可能不考慮最新的價格敏感型公司公告或定性材料。簡而言之,華爾街沒有持有任何上述股票的頭寸。
譯文內容由第三人軟體翻譯。