
We think intelligent long term investing is the way to go. But unfortunately, some companies simply don't succeed. To wit, the Topscore Fashion Co., Ltd. (SHSE:603608) share price managed to fall 61% over five long years. That's not a lot of fun for true believers. And we doubt long term believers are the only worried holders, since the stock price has declined 30% over the last twelve months. More recently, the share price has dropped a further 40% in a month. Importantly, this could be a market reaction to the recently released financial results. You can check out the latest numbers in our company report.
Given the past week has been tough on shareholders, let's investigate the fundamentals and see what we can learn.
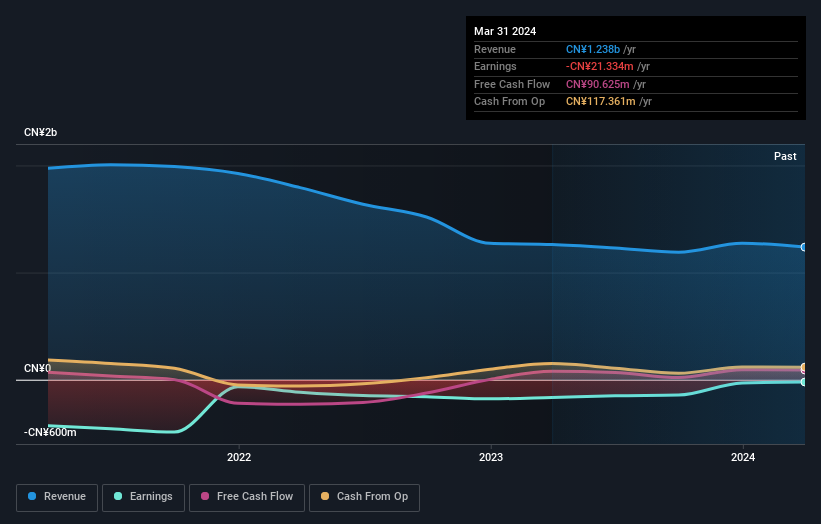
Given that Topscore Fashion didn't make a profit in the last twelve months, we'll focus on revenue growth to form a quick view of its business development. Shareholders of unprofitable companies usually desire strong revenue growth. As you can imagine, fast revenue growth, when maintained, often leads to fast profit growth.
In the last five years Topscore Fashion saw its revenue shrink by 12% per year. That's definitely a weaker result than most pre-profit companies report. Arguably, the market has responded appropriately to this business performance by sending the share price down 10% (annualized) in the same time period. We don't generally like to own companies that lose money and don't grow revenues. You might be better off spending your money on a leisure activity. This looks like a really risky stock to buy, at a glance.
The image below shows how earnings and revenue have tracked over time (if you click on the image you can see greater detail).
Balance sheet strength is crucial. It might be well worthwhile taking a look at our free report on how its financial position has changed over time.
What About The Total Shareholder Return (TSR)?
We've already covered Topscore Fashion's share price action, but we should also mention its total shareholder return (TSR). Arguably the TSR is a more complete return calculation because it accounts for the value of dividends (as if they were reinvested), along with the hypothetical value of any discounted capital that have been offered to shareholders. Dividends have been really beneficial for Topscore Fashion shareholders, and that cash payout explains why its total shareholder loss of 57%, over the last 5 years, isn't as bad as the share price return.
A Different Perspective
While the broader market lost about 8.7% in the twelve months, Topscore Fashion shareholders did even worse, losing 30%. Having said that, it's inevitable that some stocks will be oversold in a falling market. The key is to keep your eyes on the fundamental developments. Regrettably, last year's performance caps off a bad run, with the shareholders facing a total loss of 9% per year over five years. We realise that Baron Rothschild has said investors should "buy when there is blood on the streets", but we caution that investors should first be sure they are buying a high quality business. It's always interesting to track share price performance over the longer term. But to understand Topscore Fashion better, we need to consider many other factors. Like risks, for instance. Every company has them, and we've spotted 2 warning signs for Topscore Fashion (of which 1 is concerning!) you should know about.
But note: Topscore Fashion may not be the best stock to buy. So take a peek at this free list of interesting companies with past earnings growth (and further growth forecast).
Please note, the market returns quoted in this article reflect the market weighted average returns of stocks that currently trade on Chinese exchanges.
Have feedback on this article? Concerned about the content? Get in touch with us directly. Alternatively, email editorial-team (at) simplywallst.com.
This article by Simply Wall St is general in nature. We provide commentary based on historical data and analyst forecasts only using an unbiased methodology and our articles are not intended to be financial advice. It does not constitute a recommendation to buy or sell any stock, and does not take account of your objectives, or your financial situation. We aim to bring you long-term focused analysis driven by fundamental data. Note that our analysis may not factor in the latest price-sensitive company announcements or qualitative material. Simply Wall St has no position in any stocks mentioned.