
Warren Buffett famously said, 'Volatility is far from synonymous with risk.' It's only natural to consider a company's balance sheet when you examine how risky it is, since debt is often involved when a business collapses. We can see that Silk Road Medical, Inc (NASDAQ:SILK) does use debt in its business. But the real question is whether this debt is making the company risky.
When Is Debt Dangerous?
Generally speaking, debt only becomes a real problem when a company can't easily pay it off, either by raising capital or with its own cash flow. Ultimately, if the company can't fulfill its legal obligations to repay debt, shareholders could walk away with nothing. However, a more usual (but still expensive) situation is where a company must dilute shareholders at a cheap share price simply to get debt under control. Of course, the upside of debt is that it often represents cheap capital, especially when it replaces dilution in a company with the ability to reinvest at high rates of return. When we think about a company's use of debt, we first look at cash and debt together.
How Much Debt Does Silk Road Medical Carry?
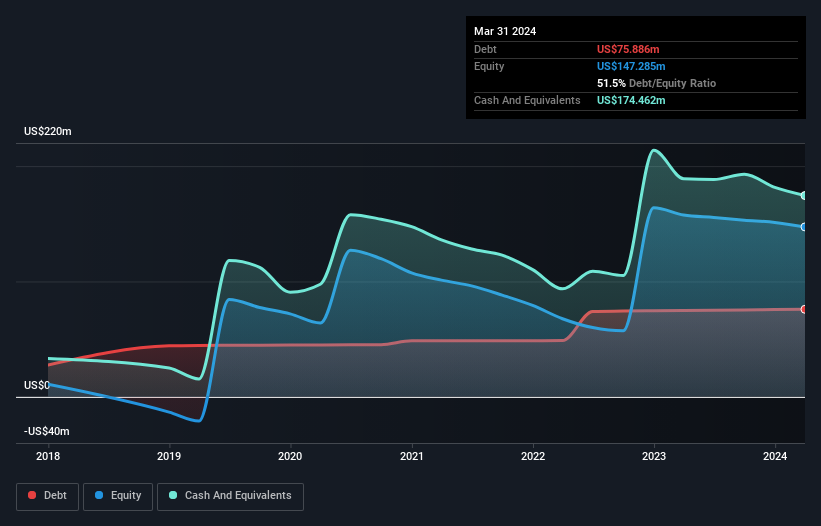
As you can see below, Silk Road Medical had US$75.9m of debt, at March 2024, which is about the same as the year before. You can click the chart for greater detail. But on the other hand it also has US$174.5m in cash, leading to a US$98.6m net cash position.
A Look At Silk Road Medical's Liabilities
The latest balance sheet data shows that Silk Road Medical had liabilities of US$21.3m due within a year, and liabilities of US$83.7m falling due after that. On the other hand, it had cash of US$174.5m and US$27.2m worth of receivables due within a year. So it can boast US$96.6m more liquid assets than total liabilities.
This surplus suggests that Silk Road Medical has a conservative balance sheet, and could probably eliminate its debt without much difficulty. Simply put, the fact that Silk Road Medical has more cash than debt is arguably a good indication that it can manage its debt safely. When analysing debt levels, the balance sheet is the obvious place to start. But it is future earnings, more than anything, that will determine Silk Road Medical's ability to maintain a healthy balance sheet going forward. So if you want to see what the professionals think, you might find this free report on analyst profit forecasts to be interesting.
Over 12 months, Silk Road Medical reported revenue of US$185m, which is a gain of 23%, although it did not report any earnings before interest and tax. Shareholders probably have their fingers crossed that it can grow its way to profits.
So How Risky Is Silk Road Medical?
Statistically speaking companies that lose money are riskier than those that make money. And we do note that Silk Road Medical had an earnings before interest and tax (EBIT) loss, over the last year. Indeed, in that time it burnt through US$37m of cash and made a loss of US$53m. While this does make the company a bit risky, it's important to remember it has net cash of US$98.6m. That means it could keep spending at its current rate for more than two years. Silk Road Medical's revenue growth shone bright over the last year, so it may well be in a position to turn a profit in due course. Pre-profit companies are often risky, but they can also offer great rewards. When analysing debt levels, the balance sheet is the obvious place to start. However, not all investment risk resides within the balance sheet - far from it. For instance, we've identified 2 warning signs for Silk Road Medical that you should be aware of.
At the end of the day, it's often better to focus on companies that are free from net debt. You can access our special list of such companies (all with a track record of profit growth). It's free.
Have feedback on this article? Concerned about the content? Get in touch with us directly. Alternatively, email editorial-team (at) simplywallst.com.
This article by Simply Wall St is general in nature. We provide commentary based on historical data and analyst forecasts only using an unbiased methodology and our articles are not intended to be financial advice. It does not constitute a recommendation to buy or sell any stock, and does not take account of your objectives, or your financial situation. We aim to bring you long-term focused analysis driven by fundamental data. Note that our analysis may not factor in the latest price-sensitive company announcements or qualitative material. Simply Wall St has no position in any stocks mentioned.