
GameStop Corporation (NYSE:GME) was slightly volatile again on Thursday, popping up almost 4% after the market opened before falling from the high-of-day amid increasing interest in the stock from bulls and short sellers.
The company hasn't released any significant news recently but from a technical analysis perspective, GameStop has settled several interesting chart patterns, which has undoubtedly contributed to an increase in the number of eyes watching the stock.
While GameStop's technicals are bullish, it should be noted that Wall Street analysts have an average 12-month price target of $5.60, which is about 63% below the current share price.
The company is also set to report its quarterly financials on June 5, which could either accelerate or destroy any potential bullish continuation.
The GameStop Chart: GameStop is trading in an uptrend, with the most recent higher high formed on May 3 at $17.45 and the most recent confirmed higher low printed at the $10.70 mark on May 1. When the stock surged about 48% between May 2 and May 3 to reach the higher high, GameStop regained the 200-day simple moving average (SMA) and has been consolidating above that area since then.
The consolidation has settled GameStop into both a bull flag pattern and a quadruple inside bar pattern above an important support zone near the $15.20 mark, where there's confluence with the 200-day SMA. Both patterns are bullish and if GameStop eventually breaks up through the upper descending trendline of the bull flag on higher-than-average volume, the measured move indicates the stock could trade up toward the $24 area.
Bearish traders want to see GameStop break down from the bull flag and fall under the 200-day SMA and the 8-day exponential moving average, which would negate the pattern. If that happens, bullish traders can watch for the stock to form a higher low to confirm the uptrend remains intact.
The stock is currently trading in oversold territory, with its relative strength index (RSI) measuring at about 70%. Continued consolidation or a move lower will help to drop the RSI back toward a more comfortable level.
GameStop has resistance above at $17.95 and at $20.10 and support below at $15.41 and at $13.36.
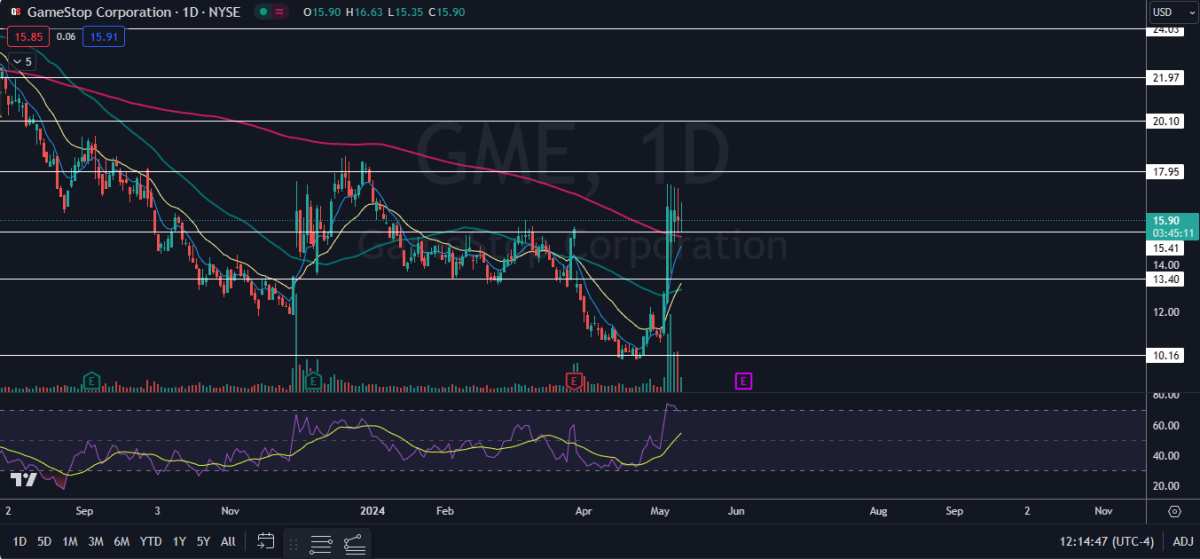
Photo: Shutterstock