
Floor & Decor Holdings' (NYSE:FND) Five-year Earnings Growth Trails the 22% YoY Shareholder Returns
Floor & Decor Holdings' (NYSE:FND) Five-year Earnings Growth Trails the 22% YoY Shareholder Returns
When you buy a stock there is always a possibility that it could drop 100%. But on the bright side, if you buy shares in a high quality company at the right price, you can gain well over 100%. One great example is Floor & Decor Holdings, Inc. (NYSE:FND) which saw its share price drive 172% higher over five years. We note the stock price is up 5.5% in the last seven days.
當你買入股票時,它總是有可能下跌100%。但好的一面是,如果你以合適的價格購買一家高質量公司的股票,你可以獲得超過100%的收益。一個很好的例子是Floor & Decor Holdings, Inc.(紐約證券交易所代碼:FND),其股價在五年內上漲了172%。我們注意到股價在過去七天中上漲了5.5%。
Since the stock has added US$649m to its market cap in the past week alone, let's see if underlying performance has been driving long-term returns.
由於該股僅在過去一週的市值就增加了6.49億美元,因此讓我們看看基礎表現是否推動了長期回報。
While markets are a powerful pricing mechanism, share prices reflect investor sentiment, not just underlying business performance. One flawed but reasonable way to assess how sentiment around a company has changed is to compare the earnings per share (EPS) with the share price.
雖然市場是一種強大的定價機制,但股價反映了投資者的情緒,而不僅僅是潛在的業務表現。評估公司情緒變化的一種有缺陷但合理的方法是將每股收益(EPS)與股價進行比較。
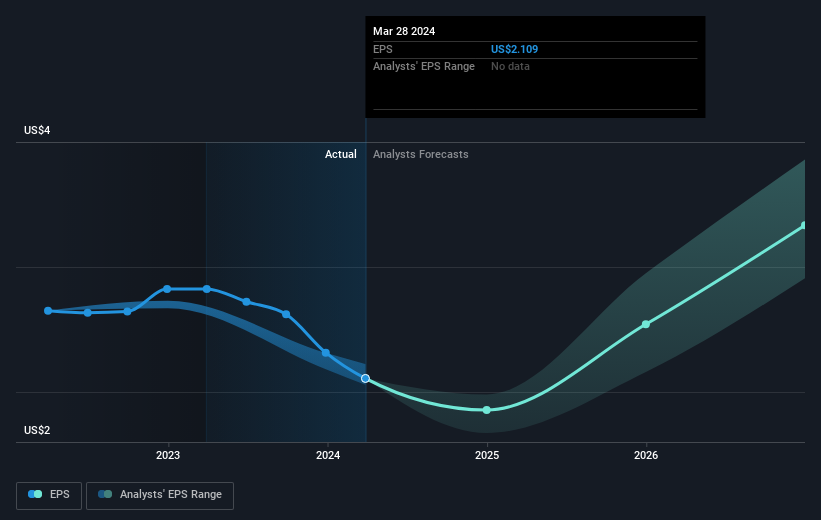
During five years of share price growth, Floor & Decor Holdings achieved compound earnings per share (EPS) growth of 12% per year. This EPS growth is slower than the share price growth of 22% per year, over the same period. So it's fair to assume the market has a higher opinion of the business than it did five years ago. And that's hardly shocking given the track record of growth. This optimism is visible in its fairly high P/E ratio of 54.99.
在五年的股價增長中,Floor & Decor Holdings實現了每年12%的複合每股收益(EPS)增長。每股收益的增長低於同期每年22%的股價增長。因此,可以公平地假設市場對該業務的看法比五年前更高。考慮到增長的記錄,這並不令人震驚。這種樂觀情緒體現在其相當高的市盈率54.99中。
You can see how EPS has changed over time in the image below (click on the chart to see the exact values).
您可以在下圖中看到 EPS 隨時間推移的變化(點擊圖表查看確切值)。
Dive deeper into Floor & Decor Holdings' key metrics by checking this interactive graph of Floor & Decor Holdings's earnings, revenue and cash flow.
查看這張Floor & Decor Holdings收益、收入和現金流的交互式圖表,深入了解Floor & Decor Holdings的關鍵指標。
A Different Perspective
不同的視角
Floor & Decor Holdings shareholders are up 25% for the year. But that was short of the market average. On the bright side, that's still a gain, and it's actually better than the average return of 22% over half a decade This could indicate that the company is winning over new investors, as it pursues its strategy. While it is well worth considering the different impacts that market conditions can have on the share price, there are other factors that are even more important. Take risks, for example - Floor & Decor Holdings has 1 warning sign we think you should be aware of.
Floor & Decor Holdings的股東今年上漲了25%。但這低於市場平均水平。好的一面是,這仍然是一個收益,實際上比五年來22%的平均回報率要好。這可能表明該公司在推行其戰略的過程中正在贏得新投資者的青睞。儘管市場狀況可能對股價產生的不同影響值得考慮,但還有其他因素更爲重要。例如,冒險吧——Floor & Decor Holdings有1個我們認爲你應該注意的警告信號。
If you like to buy stocks alongside management, then you might just love this free list of companies. (Hint: insiders have been buying them).
如果你想與管理層一起購買股票,那麼你可能會喜歡這份免費的公司名單。(提示:業內人士一直在購買它們)。
Please note, the market returns quoted in this article reflect the market weighted average returns of stocks that currently trade on American exchanges.
請注意,本文引用的市場回報反映了目前在美國交易所交易的股票的市場加權平均回報。
Have feedback on this article? Concerned about the content? Get in touch with us directly. Alternatively, email editorial-team (at) simplywallst.com.
This article by Simply Wall St is general in nature. We provide commentary based on historical data and analyst forecasts only using an unbiased methodology and our articles are not intended to be financial advice. It does not constitute a recommendation to buy or sell any stock, and does not take account of your objectives, or your financial situation. We aim to bring you long-term focused analysis driven by fundamental data. Note that our analysis may not factor in the latest price-sensitive company announcements or qualitative material. Simply Wall St has no position in any stocks mentioned.
對這篇文章有反饋嗎?對內容感到擔憂?直接聯繫我們。 或者,給編輯團隊 (at) simplywallst.com 發送電子郵件。
Simply Wall St的這篇文章本質上是籠統的。我們僅使用公正的方法根據歷史數據和分析師的預測提供評論,我們的文章無意作爲財務建議。它不構成買入或賣出任何股票的建議,也沒有考慮到您的目標或財務狀況。我們的目標是爲您提供由基本數據驅動的長期重點分析。請注意,我們的分析可能不考慮最新的價格敏感型公司公告或定性材料。簡而言之,華爾街沒有持有任何上述股票的頭寸。
譯文內容由第三人軟體翻譯。