
One simple way to benefit from the stock market is to buy an index fund. But if you choose individual stocks with prowess, you can make superior returns. For example, the Suzhou Xingye Materials Technology Co.,Ltd. (SHSE:603928) share price is up 36% in the last three years, clearly besting the market decline of around 17% (not including dividends).
On the back of a solid 7-day performance, let's check what role the company's fundamentals have played in driving long term shareholder returns.
To quote Buffett, 'Ships will sail around the world but the Flat Earth Society will flourish. There will continue to be wide discrepancies between price and value in the marketplace...' One flawed but reasonable way to assess how sentiment around a company has changed is to compare the earnings per share (EPS) with the share price.
During the three years of share price growth, Suzhou Xingye Materials TechnologyLtd actually saw its earnings per share (EPS) drop 14% per year.
So we doubt that the market is looking to EPS for its main judge of the company's value. Given this situation, it makes sense to look at other metrics too.
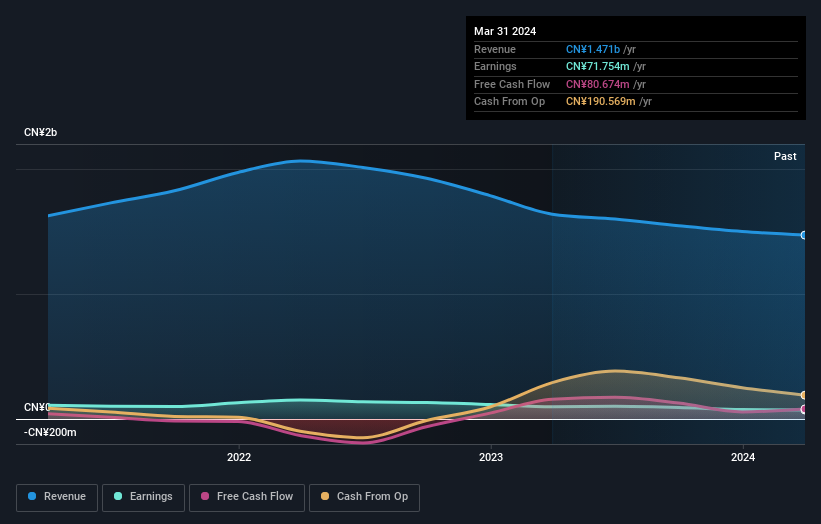
You can only imagine how long term shareholders feel about the declining revenue trend (slipping at 6.8% per year). The only thing that's clear is there is low correlation between Suzhou Xingye Materials TechnologyLtd's share price and its historic fundamental data. Further research may be required!
You can see how earnings and revenue have changed over time in the image below (click on the chart to see the exact values).
You can see how its balance sheet has strengthened (or weakened) over time in this free interactive graphic.
What About The Total Shareholder Return (TSR)?
Investors should note that there's a difference between Suzhou Xingye Materials TechnologyLtd's total shareholder return (TSR) and its share price change, which we've covered above. Arguably the TSR is a more complete return calculation because it accounts for the value of dividends (as if they were reinvested), along with the hypothetical value of any discounted capital that have been offered to shareholders. Its history of dividend payouts mean that Suzhou Xingye Materials TechnologyLtd's TSR of 50% over the last 3 years is better than the share price return.
A Different Perspective
It's good to see that Suzhou Xingye Materials TechnologyLtd has rewarded shareholders with a total shareholder return of 29% in the last twelve months. Since the one-year TSR is better than the five-year TSR (the latter coming in at 4% per year), it would seem that the stock's performance has improved in recent times. Given the share price momentum remains strong, it might be worth taking a closer look at the stock, lest you miss an opportunity. It's always interesting to track share price performance over the longer term. But to understand Suzhou Xingye Materials TechnologyLtd better, we need to consider many other factors. Even so, be aware that Suzhou Xingye Materials TechnologyLtd is showing 2 warning signs in our investment analysis , and 1 of those is significant...
We will like Suzhou Xingye Materials TechnologyLtd better if we see some big insider buys. While we wait, check out this free list of growing companies with considerable, recent, insider buying.
Please note, the market returns quoted in this article reflect the market weighted average returns of stocks that currently trade on Chinese exchanges.
Have feedback on this article? Concerned about the content? Get in touch with us directly. Alternatively, email editorial-team (at) simplywallst.com.
This article by Simply Wall St is general in nature. We provide commentary based on historical data and analyst forecasts only using an unbiased methodology and our articles are not intended to be financial advice. It does not constitute a recommendation to buy or sell any stock, and does not take account of your objectives, or your financial situation. We aim to bring you long-term focused analysis driven by fundamental data. Note that our analysis may not factor in the latest price-sensitive company announcements or qualitative material. Simply Wall St has no position in any stocks mentioned.