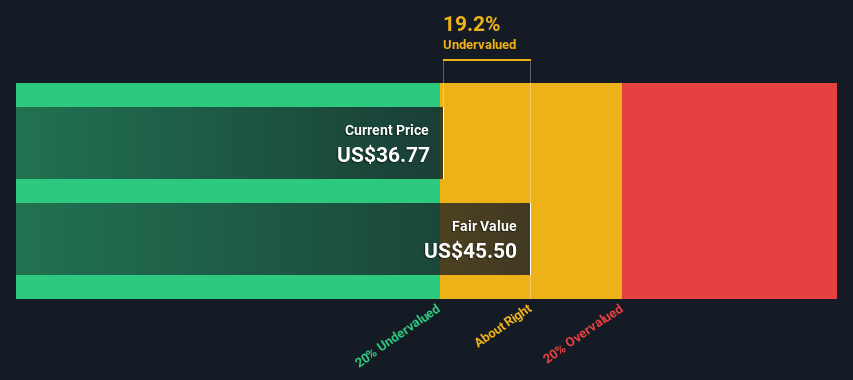
Using the 2 Stage Free Cash Flow to Equity, Simply Good Foods fair value estimate is US$45.50
Current share price of US$36.77 suggests Simply Good Foods is potentially trading close to its fair value
Our fair value estimate is 14% higher than Simply Good Foods' analyst price target of US$40.00
Today we will run through one way of estimating the intrinsic value of The Simply Good Foods Company (NASDAQ:SMPL) by estimating the company's future cash flows and discounting them to their present value. We will use the Discounted Cash Flow (DCF) model on this occasion. It may sound complicated, but actually it is quite simple!
Companies can be valued in a lot of ways, so we would point out that a DCF is not perfect for every situation. If you want to learn more about discounted cash flow, the rationale behind this calculation can be read in detail in the Simply Wall St analysis model.
The Calculation
We are going to use a two-stage DCF model, which, as the name states, takes into account two stages of growth. The first stage is generally a higher growth period which levels off heading towards the terminal value, captured in the second 'steady growth' period. To start off with, we need to estimate the next ten years of cash flows. Where possible we use analyst estimates, but when these aren't available we extrapolate the previous free cash flow (FCF) from the last estimate or reported value. We assume companies with shrinking free cash flow will slow their rate of shrinkage, and that companies with growing free cash flow will see their growth rate slow, over this period. We do this to reflect that growth tends to slow more in the early years than it does in later years.
Generally we assume that a dollar today is more valuable than a dollar in the future, and so the sum of these future cash flows is then discounted to today's value:
10-year free cash flow (FCF) forecast
2024
2025
2026
2027
2028
2029
2030
2031
2032
2033
Levered FCF ($, Millions)
US$172.3m
US$189.7m
US$195.5m
US$217.5m
US$206.0m
US$200.3m
US$197.8m
US$197.5m
US$198.7m
US$201.0m
Growth Rate Estimate Source
Analyst x5
Analyst x5
Analyst x4
Analyst x2
Analyst x1
Est @ -2.78%
Est @ -1.23%
Est @ -0.15%
Est @ 0.61%
Est @ 1.14%
Present Value ($, Millions) Discounted @ 6.1%
US$162
US$169
US$164
US$172
US$154
US$141
US$131
US$123
US$117
US$112
("Est" = FCF growth rate estimated by Simply Wall St) Present Value of 10-year Cash Flow (PVCF) = US$1.4b
After calculating the present value of future cash flows in the initial 10-year period, we need to calculate the Terminal Value, which accounts for all future cash flows beyond the first stage. The Gordon Growth formula is used to calculate Terminal Value at a future annual growth rate equal to the 5-year average of the 10-year government bond yield of 2.4%. We discount the terminal cash flows to today's value at a cost of equity of 6.1%.
Present Value of Terminal Value (PVTV)= TV / (1 + r)10= US$5.6b÷ ( 1 + 6.1%)10= US$3.1b
The total value, or equity value, is then the sum of the present value of the future cash flows, which in this case is US$4.5b. In the final step we divide the equity value by the number of shares outstanding. Relative to the current share price of US$36.8, the company appears about fair value at a 19% discount to where the stock price trades currently. Valuations are imprecise instruments though, rather like a telescope - move a few degrees and end up in a different galaxy. Do keep this in mind.
NasdaqCM:SMPL Discounted Cash Flow May 7th 2024
The Assumptions
Now the most important inputs to a discounted cash flow are the discount rate, and of course, the actual cash flows. If you don't agree with these result, have a go at the calculation yourself and play with the assumptions. The DCF also does not consider the possible cyclicality of an industry, or a company's future capital requirements, so it does not give a full picture of a company's potential performance. Given that we are looking at Simply Good Foods as potential shareholders, the cost of equity is used as the discount rate, rather than the cost of capital (or weighted average cost of capital, WACC) which accounts for debt. In this calculation we've used 6.1%, which is based on a levered beta of 0.800. Beta is a measure of a stock's volatility, compared to the market as a whole. We get our beta from the industry average beta of globally comparable companies, with an imposed limit between 0.8 and 2.0, which is a reasonable range for a stable business.
SWOT Analysis for Simply Good Foods
Strength
Earnings growth over the past year exceeded the industry.
Debt is not viewed as a risk.
Balance sheet summary for SMPL.
Weakness
Earnings growth over the past year is below its 5-year average.
Opportunity
Annual earnings are forecast to grow for the next 3 years.
Current share price is below our estimate of fair value.
Threat
Annual earnings are forecast to grow slower than the American market.
What else are analysts forecasting for SMPL?
Looking Ahead:
Whilst important, the DCF calculation shouldn't be the only metric you look at when researching a company. It's not possible to obtain a foolproof valuation with a DCF model. Rather it should be seen as a guide to "what assumptions need to be true for this stock to be under/overvalued?" For example, changes in the company's cost of equity or the risk free rate can significantly impact the valuation. For Simply Good Foods, we've put together three fundamental aspects you should assess:
Financial Health: Does SMPL have a healthy balance sheet? Take a look at our free balance sheet analysis with six simple checks on key factors like leverage and risk.
Future Earnings: How does SMPL's growth rate compare to its peers and the wider market? Dig deeper into the analyst consensus number for the upcoming years by interacting with our free analyst growth expectation chart.
Other High Quality Alternatives: Do you like a good all-rounder? Explore our interactive list of high quality stocks to get an idea of what else is out there you may be missing!
PS. Simply Wall St updates its DCF calculation for every American stock every day, so if you want to find the intrinsic value of any other stock just search here.
Have feedback on this article? Concerned about the content?Get in touch with us directly. Alternatively, email editorial-team (at) simplywallst.com. This article by Simply Wall St is general in nature. We provide commentary based on historical data and analyst forecasts only using an unbiased methodology and our articles are not intended to be financial advice. It does not constitute a recommendation to buy or sell any stock, and does not take account of your objectives, or your financial situation. We aim to bring you long-term focused analysis driven by fundamental data. Note that our analysis may not factor in the latest price-sensitive company announcements or qualitative material. Simply Wall St has no position in any stocks mentioned.
關鍵見解
使用兩階段自由現金流股權,Simply Good Foods的公允價值估計爲45.50美元
目前36.77美元的股價表明Simply Good Foods的交易價格可能接近其公允價值
我們的公允價值估計比Simply Good Foods的分析師目標股價40.00美元高出14%
今天,我們將介紹一種估算Simply Good Foods Company(納斯達克股票代碼:SMPL)內在價值的方法,即估算公司的未來現金流並將其折現爲現值。在這種情況下,我們將使用折扣現金流(DCF)模型。聽起來可能很複雜,但實際上很簡單!
現在,貼現現金流的最重要輸入是貼現率,當然還有實際現金流。如果你不同意這些結果,那就自己計算一下,試一試假設。DCF也沒有考慮一個行業可能的週期性,也沒有考慮公司未來的資本需求,因此它沒有全面反映公司的潛在表現。鑑於我們將Simply Good Foods視爲潛在股東,因此使用權益成本作爲貼現率,而不是構成債務的資本成本(或加權平均資本成本,WACC)。在此計算中,我們使用了6.1%,這是基於0.800的槓桿測試版。Beta是衡量股票與整個市場相比波動性的指標。我們的測試版來自全球可比公司的行業平均貝塔值,設定在0.8到2.0之間,這是一個穩定的業務的合理範圍。
純正好食物的 SWOT 分析
力量
過去一年的收益增長超過了該行業。
債務不被視爲風險。
SMPL 的資產負債表摘要。
弱點
過去一年的收益增長低於其5年平均水平。
機會
預計未來三年的年收入將增長。
目前的股價低於我們對公允價值的估計。
威脅
預計年收益的增長速度將低於美國市場。
分析師對SMPL還有什麼預測?
展望未來:
儘管重要,但DCF的計算不應是你在研究公司時唯一考慮的指標。使用DCF模型不可能獲得萬無一失的估值。相反,它應該被視爲 “需要哪些假設才能低估/高估這隻股票的價值?” 的指南例如,公司權益成本或無風險利率的變化會對估值產生重大影響。對於Simply Good Foods,我們彙總了您應該評估的三個基本方面: