
CRA International's (NASDAQ:CRAI) stock is up by a considerable 50% over the past three months. Given that the market rewards strong financials in the long-term, we wonder if that is the case in this instance. Specifically, we decided to study CRA International's ROE in this article.
ROE or return on equity is a useful tool to assess how effectively a company can generate returns on the investment it received from its shareholders. In short, ROE shows the profit each dollar generates with respect to its shareholder investments.
How Is ROE Calculated?
Return on equity can be calculated by using the formula:
Return on Equity = Net Profit (from continuing operations) ÷ Shareholders' Equity
So, based on the above formula, the ROE for CRA International is:
20% = US$43m ÷ US$212m (Based on the trailing twelve months to March 2024).
The 'return' is the amount earned after tax over the last twelve months. That means that for every $1 worth of shareholders' equity, the company generated $0.20 in profit.
What Has ROE Got To Do With Earnings Growth?
Thus far, we have learned that ROE measures how efficiently a company is generating its profits. Depending on how much of these profits the company reinvests or "retains", and how effectively it does so, we are then able to assess a company's earnings growth potential. Assuming all else is equal, companies that have both a higher return on equity and higher profit retention are usually the ones that have a higher growth rate when compared to companies that don't have the same features.
CRA International's Earnings Growth And 20% ROE
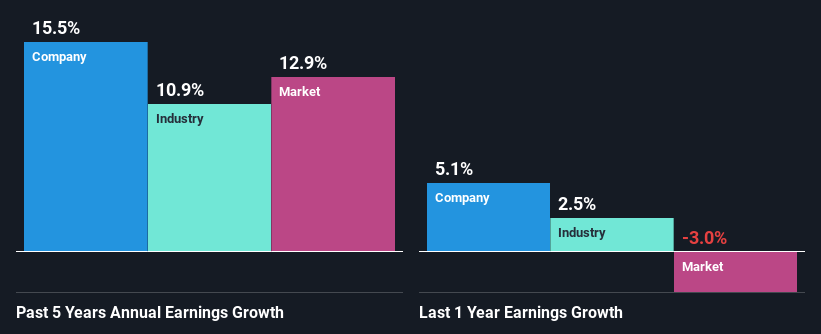
At first glance, CRA International seems to have a decent ROE. Further, the company's ROE compares quite favorably to the industry average of 14%. Probably as a result of this, CRA International was able to see a decent growth of 16% over the last five years.
As a next step, we compared CRA International's net income growth with the industry, and pleasingly, we found that the growth seen by the company is higher than the average industry growth of 11%.
The basis for attaching value to a company is, to a great extent, tied to its earnings growth. What investors need to determine next is if the expected earnings growth, or the lack of it, is already built into the share price. By doing so, they will have an idea if the stock is headed into clear blue waters or if swampy waters await. Has the market priced in the future outlook for CRAI? You can find out in our latest intrinsic value infographic research report.
Is CRA International Making Efficient Use Of Its Profits?
In CRA International's case, its respectable earnings growth can probably be explained by its low three-year median payout ratio of 23% (or a retention ratio of 77%), which suggests that the company is investing most of its profits to grow its business.
Moreover, CRA International is determined to keep sharing its profits with shareholders which we infer from its long history of eight years of paying a dividend.
Summary
In total, we are pretty happy with CRA International's performance. Particularly, we like that the company is reinvesting heavily into its business, and at a high rate of return. Unsurprisingly, this has led to an impressive earnings growth. That being so, a study of the latest analyst forecasts show that the company is expected to see a slowdown in its future earnings growth. To know more about the company's future earnings growth forecasts take a look at this free report on analyst forecasts for the company to find out more.
Have feedback on this article? Concerned about the content? Get in touch with us directly. Alternatively, email editorial-team (at) simplywallst.com.
This article by Simply Wall St is general in nature. We provide commentary based on historical data and analyst forecasts only using an unbiased methodology and our articles are not intended to be financial advice. It does not constitute a recommendation to buy or sell any stock, and does not take account of your objectives, or your financial situation. We aim to bring you long-term focused analysis driven by fundamental data. Note that our analysis may not factor in the latest price-sensitive company announcements or qualitative material. Simply Wall St has no position in any stocks mentioned.