
 Yahoo Finance
 5E Resources (Catalist:NLC) Is Reinvesting To Multiply In Value
If we want to find a stock that could multiply over the long term, what are the underlying trends we should look for? Ideally, a business will show two trends; firstly a growing return on capital employed (ROCE) and secondly, an increasing amount of capital employed. Ultimately, this demonstrates that it's a business that is reinvesting profits at increasing rates of return. Ergo, when we looked at the ROCE trends at 5E Resources (Catalist:NLC), we liked what we saw.
Return On Capital Employed (ROCE): What Is It?
If you haven't worked with ROCE before, it measures the 'return' (pre-tax profit) a company generates from capital employed in its business. Analysts use this formula to calculate it for 5E Resources:
Return on Capital Employed = Earnings Before Interest and Tax (EBIT) ÷ (Total Assets - Current Liabilities)
0.21 = RM26m ÷ (RM138m - RM13m) (Based on the trailing twelve months to December 2023).
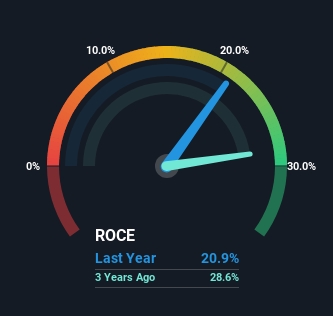
Therefore, 5E Resources has an ROCE of 21%. In absolute terms that's a great return and it's even better than the Commercial Services industry average of 8.2%.
See our latest analysis for 5E Resources
While the past is not representative of the future, it can be helpful to know how a company has performed historically, which is why we have this chart above. If you want to delve into the historical earnings , check out these free graphs detailing revenue and cash flow performance of 5E Resources.
How Are Returns Trending?
We'd be pretty happy with returns on capital like 5E Resources. The company has employed 181% more capital in the last five years, and the returns on that capital have remained stable at 21%. Returns like this are the envy of most businesses and given it has repeatedly reinvested at these rates, that's even better. If these trends can continue, it wouldn't surprise us if the company became a multi-bagger.
The Key Takeaway
In the end, the company has proven it can reinvest it's capital at high rates of returns, which you'll remember is a trait of a multi-bagger. Therefore it's no surprise that shareholders have earned a respectable 9.1% return if they held over the last year. So while investors seem to be recognizing these promising trends, we still believe the stock deserves further research.
If you want to know some of the risks facing 5E Resources we've found 2 warning signs (1 is concerning!) that you should be aware of before investing here.
If you'd like to see other companies earning high returns, check out our free list of companies earning high returns with solid balance sheets here.
Have feedback on this article? Concerned about the content? Get in touch with us directly. Alternatively, email editorial-team (at) simplywallst.com.
This article by Simply Wall St is general in nature. We provide commentary based on historical data and analyst forecasts only using an unbiased methodology and our articles are not intended to be financial advice. It does not constitute a recommendation to buy or sell any stock, and does not take account of your objectives, or your financial situation. We aim to bring you long-term focused analysis driven by fundamental data. Note that our analysis may not factor in the latest price-sensitive company announcements or qualitative material. Simply Wall St has no position in any stocks mentioned.
