
Those holding Yoma Strategic Holdings Ltd. (SGX:Z59) shares would be relieved that the share price has rebounded 28% in the last thirty days, but it needs to keep going to repair the recent damage it has caused to investor portfolios. Not all shareholders will be feeling jubilant, since the share price is still down a very disappointing 47% in the last twelve months.
Although its price has surged higher, Yoma Strategic Holdings may still be sending bullish signals at the moment with its price-to-sales (or "P/S") ratio of 0.5x, since almost half of all companies in the Real Estate industry in Singapore have P/S ratios greater than 1.9x and even P/S higher than 5x are not unusual. Although, it's not wise to just take the P/S at face value as there may be an explanation why it's limited.
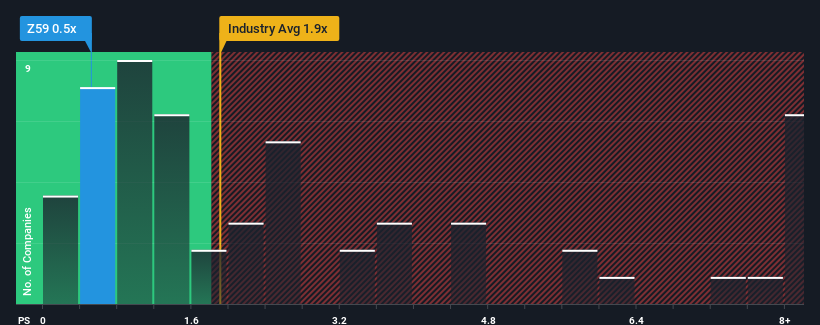
SGX:Z59 Price to Sales Ratio vs Industry May 6th 2024
What Does Yoma Strategic Holdings' Recent Performance Look Like?
Recent times have been quite advantageous for Yoma Strategic Holdings as its revenue has been rising very briskly. One possibility is that the P/S ratio is low because investors think this strong revenue growth might actually underperform the broader industry in the near future. If that doesn't eventuate, then existing shareholders have reason to be quite optimistic about the future direction of the share price.
Although there are no analyst estimates available for Yoma Strategic Holdings, take a look at this free data-rich visualisation to see how the company stacks up on earnings, revenue and cash flow.
Do Revenue Forecasts Match The Low P/S Ratio?
The only time you'd be truly comfortable seeing a P/S as low as Yoma Strategic Holdings' is when the company's growth is on track to lag the industry.
Retrospectively, the last year delivered an exceptional 129% gain to the company's top line. Pleasingly, revenue has also lifted 85% in aggregate from three years ago, thanks to the last 12 months of growth. So we can start by confirming that the company has done a great job of growing revenue over that time.
Comparing that to the industry, which is only predicted to deliver 1.0% growth in the next 12 months, the company's momentum is stronger based on recent medium-term annualised revenue results.
With this information, we find it odd that Yoma Strategic Holdings is trading at a P/S lower than the industry. Apparently some shareholders believe the recent performance has exceeded its limits and have been accepting significantly lower selling prices.
What Does Yoma Strategic Holdings' P/S Mean For Investors?
The latest share price surge wasn't enough to lift Yoma Strategic Holdings' P/S close to the industry median. Using the price-to-sales ratio alone to determine if you should sell your stock isn't sensible, however it can be a practical guide to the company's future prospects.
Our examination of Yoma Strategic Holdings revealed its three-year revenue trends aren't boosting its P/S anywhere near as much as we would have predicted, given they look better than current industry expectations. When we see robust revenue growth that outpaces the industry, we presume that there are notable underlying risks to the company's future performance, which is exerting downward pressure on the P/S ratio. It appears many are indeed anticipating revenue instability, because the persistence of these recent medium-term conditions would normally provide a boost to the share price.
It's always necessary to consider the ever-present spectre of investment risk. We've identified 3 warning signs with Yoma Strategic Holdings (at least 1 which is concerning), and understanding these should be part of your investment process.
If these risks are making you reconsider your opinion on Yoma Strategic Holdings, explore our interactive list of high quality stocks to get an idea of what else is out there.
Have feedback on this article? Concerned about the content? Get in touch with us directly. Alternatively, email editorial-team (at) simplywallst.com.
This article by Simply Wall St is general in nature. We provide commentary based on historical data and analyst forecasts only using an unbiased methodology and our articles are not intended to be financial advice. It does not constitute a recommendation to buy or sell any stock, and does not take account of your objectives, or your financial situation. We aim to bring you long-term focused analysis driven by fundamental data. Note that our analysis may not factor in the latest price-sensitive company announcements or qualitative material. Simply Wall St has no position in any stocks mentioned.