
The Educational Development Corporation (NASDAQ:EDUC) share price has softened a substantial 32% over the previous 30 days, handing back much of the gains the stock has made lately. To make matters worse, the recent drop has wiped out a year's worth of gains with the share price now back where it started a year ago.
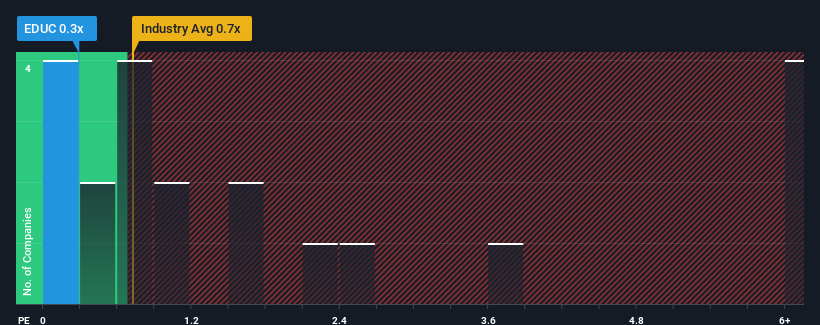
In spite of the heavy fall in price, Educational Development's price-to-sales (or "P/S") ratio of 0.3x might still make it look like a buy right now compared to the Retail Distributors industry in the United States, where around half of the companies have P/S ratios above 0.9x and even P/S above 3x are quite common. Nonetheless, we'd need to dig a little deeper to determine if there is a rational basis for the reduced P/S.
How Has Educational Development Performed Recently?
As an illustration, revenue has deteriorated at Educational Development over the last year, which is not ideal at all. Perhaps the market believes the recent revenue performance isn't good enough to keep up the industry, causing the P/S ratio to suffer. However, if this doesn't eventuate then existing shareholders may be feeling optimistic about the future direction of the share price.
Want the full picture on earnings, revenue and cash flow for the company? Then our free report on Educational Development will help you shine a light on its historical performance.Do Revenue Forecasts Match The Low P/S Ratio?
Educational Development's P/S ratio would be typical for a company that's only expected to deliver limited growth, and importantly, perform worse than the industry.
Retrospectively, the last year delivered a frustrating 41% decrease to the company's top line. This means it has also seen a slide in revenue over the longer-term as revenue is down 69% in total over the last three years. Therefore, it's fair to say the revenue growth recently has been undesirable for the company.
In contrast to the company, the rest of the industry is expected to grow by 6.3% over the next year, which really puts the company's recent medium-term revenue decline into perspective.
With this in mind, we understand why Educational Development's P/S is lower than most of its industry peers. However, we think shrinking revenues are unlikely to lead to a stable P/S over the longer term, which could set up shareholders for future disappointment. Even just maintaining these prices could be difficult to achieve as recent revenue trends are already weighing down the shares.
What Does Educational Development's P/S Mean For Investors?
Educational Development's recently weak share price has pulled its P/S back below other Retail Distributors companies. While the price-to-sales ratio shouldn't be the defining factor in whether you buy a stock or not, it's quite a capable barometer of revenue expectations.
Our examination of Educational Development confirms that the company's shrinking revenue over the past medium-term is a key factor in its low price-to-sales ratio, given the industry is projected to grow. At this stage investors feel the potential for an improvement in revenue isn't great enough to justify a higher P/S ratio. If recent medium-term revenue trends continue, it's hard to see the share price moving strongly in either direction in the near future under these circumstances.
It's always necessary to consider the ever-present spectre of investment risk. We've identified 5 warning signs with Educational Development (at least 1 which is significant), and understanding them should be part of your investment process.
If companies with solid past earnings growth is up your alley, you may wish to see this free collection of other companies with strong earnings growth and low P/E ratios.
Have feedback on this article? Concerned about the content? Get in touch with us directly. Alternatively, email editorial-team (at) simplywallst.com.
This article by Simply Wall St is general in nature. We provide commentary based on historical data and analyst forecasts only using an unbiased methodology and our articles are not intended to be financial advice. It does not constitute a recommendation to buy or sell any stock, and does not take account of your objectives, or your financial situation. We aim to bring you long-term focused analysis driven by fundamental data. Note that our analysis may not factor in the latest price-sensitive company announcements or qualitative material. Simply Wall St has no position in any stocks mentioned.