
Harmonic (NASDAQ:HLIT) Delivers Shareholders Notable 14% CAGR Over 5 Years, Surging 21% in the Last Week Alone
Harmonic (NASDAQ:HLIT) Delivers Shareholders Notable 14% CAGR Over 5 Years, Surging 21% in the Last Week Alone
Harmonic Inc. (NASDAQ:HLIT) shareholders might be concerned after seeing the share price drop 16% in the last quarter. While that's not great, the returns over five years have been decent. The share price is up 94%, which is better than the market return of 88%.
Harmonic Inc.(纳斯达克股票代码:HLIT)股东在看到上个季度股价下跌16%后可能会感到担忧。虽然这不太好,但五年来的回报还是不错的。股价上涨了94%,好于88%的市场回报率。
Since it's been a strong week for Harmonic shareholders, let's have a look at trend of the longer term fundamentals.
由于对Harmonic股东来说,这是强劲的一周,让我们来看看长期基本面的趋势。
While markets are a powerful pricing mechanism, share prices reflect investor sentiment, not just underlying business performance. One imperfect but simple way to consider how the market perception of a company has shifted is to compare the change in the earnings per share (EPS) with the share price movement.
虽然市场是一种强大的定价机制,但股价反映了投资者的情绪,而不仅仅是潜在的业务表现。考虑市场对公司的看法发生了怎样的变化的一种不完美但简单的方法是将每股收益(EPS)的变化与股价走势进行比较。
During the last half decade, Harmonic became profitable. That would generally be considered a positive, so we'd hope to see the share price to rise.
在过去的五年中,Harmonic实现了盈利。这通常被认为是积极的,因此我们希望看到股价上涨。
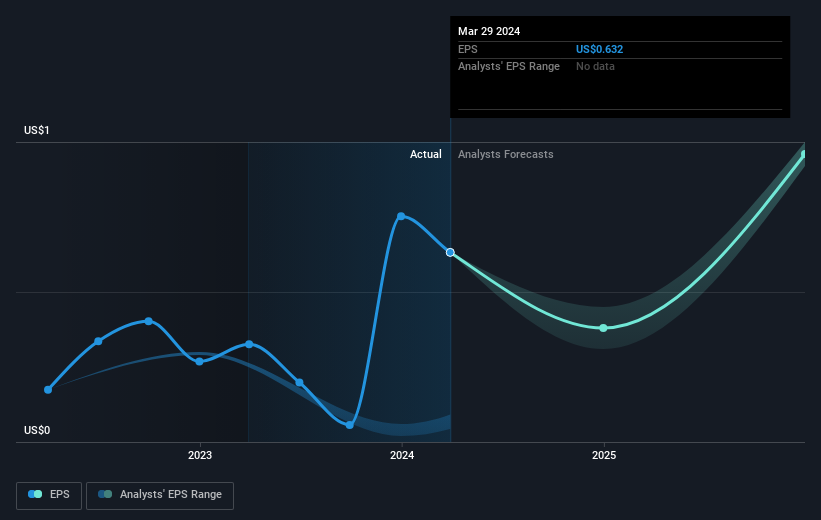
The company's earnings per share (over time) is depicted in the image below (click to see the exact numbers).
该公司的每股收益(随着时间的推移)如下图所示(点击查看确切数字)。
We know that Harmonic has improved its bottom line over the last three years, but what does the future have in store? This free interactive report on Harmonic's balance sheet strength is a great place to start, if you want to investigate the stock further.
我们知道Harmonic在过去三年中提高了利润,但是未来会发生什么?如果你想进一步调查股票,这份关于Harmonic资产负债表实力的免费互动报告是一个很好的起点。
A Different Perspective
不同的视角
While the broader market gained around 26% in the last year, Harmonic shareholders lost 18%. However, keep in mind that even the best stocks will sometimes underperform the market over a twelve month period. On the bright side, long term shareholders have made money, with a gain of 14% per year over half a decade. It could be that the recent sell-off is an opportunity, so it may be worth checking the fundamental data for signs of a long term growth trend. While it is well worth considering the different impacts that market conditions can have on the share price, there are other factors that are even more important. Consider for instance, the ever-present spectre of investment risk. We've identified 2 warning signs with Harmonic , and understanding them should be part of your investment process.
去年整体市场上涨了约26%,而Harmonic的股东却下跌了18%。但是,请记住,即使是最好的股票有时也会在十二个月内表现不如市场。好的一面是,长期股东赚了钱,在过去的五年中,每年增长14%。最近的抛售可能是一个机会,因此可能值得查看基本面数据以寻找长期增长趋势的迹象。尽管市场状况可能对股价产生的不同影响值得考虑,但还有其他因素更为重要。例如,投资风险的幽灵无处不在。我们已经确定了Harmonic的两个警告信号,了解它们应该是您投资过程的一部分。
Of course, you might find a fantastic investment by looking elsewhere. So take a peek at this free list of companies we expect will grow earnings.
当然,通过寻找其他地方,你可能会找到一笔不错的投资。因此,请看一下我们预计收益将增加的这份免费公司名单。
Please note, the market returns quoted in this article reflect the market weighted average returns of stocks that currently trade on American exchanges.
请注意,本文引用的市场回报反映了目前在美国交易所交易的股票的市场加权平均回报。
Have feedback on this article? Concerned about the content? Get in touch with us directly. Alternatively, email editorial-team (at) simplywallst.com.
This article by Simply Wall St is general in nature. We provide commentary based on historical data and analyst forecasts only using an unbiased methodology and our articles are not intended to be financial advice. It does not constitute a recommendation to buy or sell any stock, and does not take account of your objectives, or your financial situation. We aim to bring you long-term focused analysis driven by fundamental data. Note that our analysis may not factor in the latest price-sensitive company announcements or qualitative material. Simply Wall St has no position in any stocks mentioned.
对这篇文章有反馈吗?对内容感到担忧?直接联系我们。 或者,给编辑团队 (at) simplywallst.com 发送电子邮件。
Simply Wall St的这篇文章本质上是笼统的。我们仅使用公正的方法根据历史数据和分析师的预测提供评论,我们的文章无意作为财务建议。它不构成买入或卖出任何股票的建议,也没有考虑到您的目标或财务状况。我们的目标是为您提供由基本数据驱动的长期重点分析。请注意,我们的分析可能不考虑最新的价格敏感型公司公告或定性材料。简而言之,华尔街没有持有任何上述股票的头寸。
译文内容由第三方软件翻译。