
The Past Three-year Earnings Decline for PNM Resources (NYSE:PNM) Likely Explains Shareholders Long-term Losses
The Past Three-year Earnings Decline for PNM Resources (NYSE:PNM) Likely Explains Shareholders Long-term Losses
As an investor its worth striving to ensure your overall portfolio beats the market average. But if you try your hand at stock picking, your risk returning less than the market. We regret to report that long term PNM Resources, Inc. (NYSE:PNM) shareholders have had that experience, with the share price dropping 24% in three years, versus a market return of about 16%.
作爲投資者,值得努力確保您的整體投資組合超過市場平均水平。但是,如果你嘗試選股,你的風險回報低於市場。我們遺憾地報告,PNM Resources, Inc.(紐約證券交易所代碼:PNM)的長期股東有過這樣的經歷,股價在三年內下跌了24%,而市場回報率約爲16%。
On a more encouraging note the company has added US$125m to its market cap in just the last 7 days, so let's see if we can determine what's driven the three-year loss for shareholders.
更令人鼓舞的是,該公司的市值在過去的7天內就增加了1.25億美元,因此,讓我們看看我們能否確定導致股東三年虧損的原因。
To quote Buffett, 'Ships will sail around the world but the Flat Earth Society will flourish. There will continue to be wide discrepancies between price and value in the marketplace...' One flawed but reasonable way to assess how sentiment around a company has changed is to compare the earnings per share (EPS) with the share price.
引用巴菲特的話說:“船隻將在世界各地航行,但Flat Earth Society將蓬勃發展。市場上的價格和價值之間將繼續存在巨大差異...”評估公司情緒變化的一種有缺陷但合理的方法是將每股收益(EPS)與股價進行比較。
PNM Resources saw its EPS decline at a compound rate of 29% per year, over the last three years. In comparison the 9% compound annual share price decline isn't as bad as the EPS drop-off. So, despite the prior disappointment, shareholders must have some confidence the situation will improve, longer term.
在過去三年中,PNM Resources的每股收益以每年29%的複合速度下降。相比之下,9%的複合年股價下跌幅度沒有每股收益的下降那麼嚴重。因此,儘管此前曾令人失望,但股東必須有一定的信心,從長遠來看,情況會有所改善。
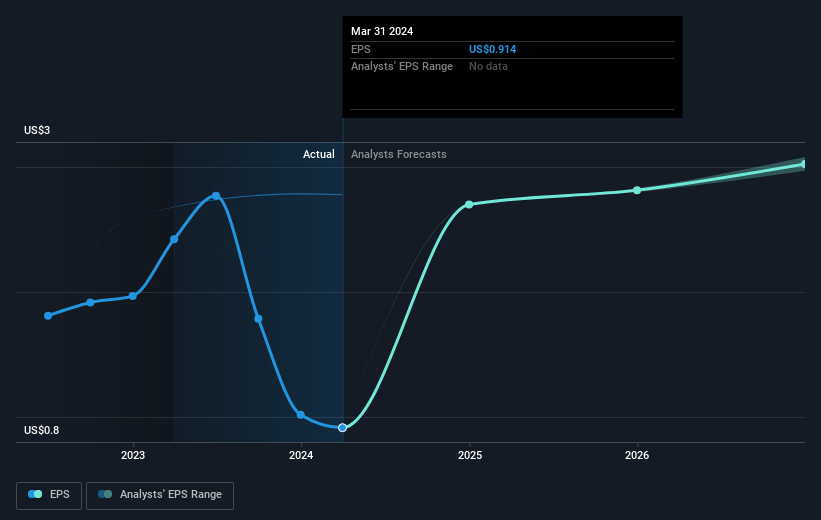
You can see how EPS has changed over time in the image below (click on the chart to see the exact values).
您可以在下圖中看到 EPS 隨時間推移的變化(點擊圖表查看確切值)。
Dive deeper into PNM Resources' key metrics by checking this interactive graph of PNM Resources's earnings, revenue and cash flow.
查看這張PNM Resources收益、收入和現金流的交互式圖表,深入了解PNM Resources的關鍵指標。
What About Dividends?
分紅呢?
It is important to consider the total shareholder return, as well as the share price return, for any given stock. The TSR is a return calculation that accounts for the value of cash dividends (assuming that any dividend received was reinvested) and the calculated value of any discounted capital raisings and spin-offs. It's fair to say that the TSR gives a more complete picture for stocks that pay a dividend. We note that for PNM Resources the TSR over the last 3 years was -16%, which is better than the share price return mentioned above. This is largely a result of its dividend payments!
重要的是要考慮任何給定股票的股東總回報率和股價回報率。股東總回報率是一種回報計算方法,它考慮了現金分紅的價值(假設收到的任何股息都經過再投資)以及任何貼現資本籌集和分拆的計算價值。可以公平地說,股東總回報率爲支付股息的股票提供了更完整的畫面。我們注意到,對於PNM Resources而言,過去3年的股東總回報率爲-16%,好於上述股價回報率。這在很大程度上是其股息支付的結果!
A Different Perspective
不同的視角
PNM Resources shareholders are down 18% for the year (even including dividends), but the market itself is up 26%. Even the share prices of good stocks drop sometimes, but we want to see improvements in the fundamental metrics of a business, before getting too interested. Unfortunately, last year's performance may indicate unresolved challenges, given that it was worse than the annualised loss of 1.2% over the last half decade. We realise that Baron Rothschild has said investors should "buy when there is blood on the streets", but we caution that investors should first be sure they are buying a high quality business. I find it very interesting to look at share price over the long term as a proxy for business performance. But to truly gain insight, we need to consider other information, too. Case in point: We've spotted 5 warning signs for PNM Resources you should be aware of, and 2 of them can't be ignored.
PNM Resources的股東今年下跌了18%(甚至包括股息),但市場本身卻上漲了26%。即使是優質股票的股價有時也會下跌,但我們希望在過於感興趣之前看到企業基本指標的改善。不幸的是,去年的表現可能預示着尚未解決的挑戰,因爲它比過去五年中1.2%的年化虧損還要糟糕。我們意識到羅斯柴爾德男爵曾說過,投資者應該 “在街頭流血時買入”,但我們警告說,投資者應首先確保他們購買的是高質量的企業。我發現將長期股價視爲業務績效的代表非常有趣。但是,要真正獲得見解,我們還需要考慮其他信息。一個很好的例子:我們已經發現了你應該注意的5個PNM Resources警告信號,其中兩個不容忽視。
But note: PNM Resources may not be the best stock to buy. So take a peek at this free list of interesting companies with past earnings growth (and further growth forecast).
但請注意:PNM Resources可能不是最值得購買的股票。因此,來看看這份過去盈利增長(以及進一步增長預測)的有趣公司的免費清單。
Please note, the market returns quoted in this article reflect the market weighted average returns of stocks that currently trade on American exchanges.
請注意,本文引用的市場回報反映了目前在美國交易所交易的股票的市場加權平均回報。
Have feedback on this article? Concerned about the content? Get in touch with us directly. Alternatively, email editorial-team (at) simplywallst.com.
This article by Simply Wall St is general in nature. We provide commentary based on historical data and analyst forecasts only using an unbiased methodology and our articles are not intended to be financial advice. It does not constitute a recommendation to buy or sell any stock, and does not take account of your objectives, or your financial situation. We aim to bring you long-term focused analysis driven by fundamental data. Note that our analysis may not factor in the latest price-sensitive company announcements or qualitative material. Simply Wall St has no position in any stocks mentioned.
對這篇文章有反饋嗎?對內容感到擔憂?直接聯繫我們。 或者,給編輯團隊 (at) simplywallst.com 發送電子郵件。
Simply Wall St的這篇文章本質上是籠統的。我們僅使用公正的方法根據歷史數據和分析師的預測提供評論,我們的文章無意作爲財務建議。它不構成買入或賣出任何股票的建議,也沒有考慮到您的目標或財務狀況。我們的目標是爲您提供由基本數據驅動的長期重點分析。請注意,我們的分析可能不考慮最新的價格敏感型公司公告或定性材料。簡而言之,華爾街沒有持有任何上述股票的頭寸。
譯文內容由第三人軟體翻譯。