
 Yahoo Finance
 Taka Jewellery Holdings (Catalist:42L) Might Have The Makings Of A Multi-Bagger
Did you know there are some financial metrics that can provide clues of a potential multi-bagger? Typically, we'll want to notice a trend of growing return on capital employed (ROCE) and alongside that, an expanding base of capital employed. Put simply, these types of businesses are compounding machines, meaning they are continually reinvesting their earnings at ever-higher rates of return. Speaking of which, we noticed some great changes in Taka Jewellery Holdings' (Catalist:42L) returns on capital, so let's have a look.
Return On Capital Employed (ROCE): What Is It?
Just to clarify if you're unsure, ROCE is a metric for evaluating how much pre-tax income (in percentage terms) a company earns on the capital invested in its business. To calculate this metric for Taka Jewellery Holdings, this is the formula:
Return on Capital Employed = Earnings Before Interest and Tax (EBIT) ÷ (Total Assets - Current Liabilities)
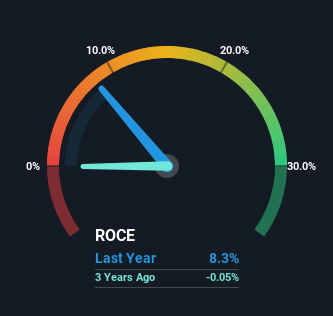
0.083 = S$12m ÷ (S$205m - S$63m) (Based on the trailing twelve months to December 2023).
Thus, Taka Jewellery Holdings has an ROCE of 8.3%. In absolute terms, that's a low return and it also under-performs the Specialty Retail industry average of 12%.
See our latest analysis for Taka Jewellery Holdings
While the past is not representative of the future, it can be helpful to know how a company has performed historically, which is why we have this chart above. If you're interested in investigating Taka Jewellery Holdings' past further, check out this free graph covering Taka Jewellery Holdings' past earnings, revenue and cash flow.
So How Is Taka Jewellery Holdings' ROCE Trending?
Even though ROCE is still low in absolute terms, it's good to see it's heading in the right direction. Over the last five years, returns on capital employed have risen substantially to 8.3%. The company is effectively making more money per dollar of capital used, and it's worth noting that the amount of capital has increased too, by 29%. This can indicate that there's plenty of opportunities to invest capital internally and at ever higher rates, a combination that's common among multi-baggers.
The Bottom Line On Taka Jewellery Holdings' ROCE
In summary, it's great to see that Taka Jewellery Holdings can compound returns by consistently reinvesting capital at increasing rates of return, because these are some of the key ingredients of those highly sought after multi-baggers. Astute investors may have an opportunity here because the stock has declined 19% in the last five years. So researching this company further and determining whether or not these trends will continue seems justified.
If you want to know some of the risks facing Taka Jewellery Holdings we've found 2 warning signs (1 doesn't sit too well with us!) that you should be aware of before investing here.
For those who like to invest in solid companies, check out this free list of companies with solid balance sheets and high returns on equity.
Have feedback on this article? Concerned about the content? Get in touch with us directly. Alternatively, email editorial-team (at) simplywallst.com.
This article by Simply Wall St is general in nature. We provide commentary based on historical data and analyst forecasts only using an unbiased methodology and our articles are not intended to be financial advice. It does not constitute a recommendation to buy or sell any stock, and does not take account of your objectives, or your financial situation. We aim to bring you long-term focused analysis driven by fundamental data. Note that our analysis may not factor in the latest price-sensitive company announcements or qualitative material. Simply Wall St has no position in any stocks mentioned.
