
XBP Europe Holdings, Inc. (NASDAQ:XBP) shareholders that were waiting for something to happen have been dealt a blow with a 37% share price drop in the last month. The recent drop completes a disastrous twelve months for shareholders, who are sitting on a 88% loss during that time.
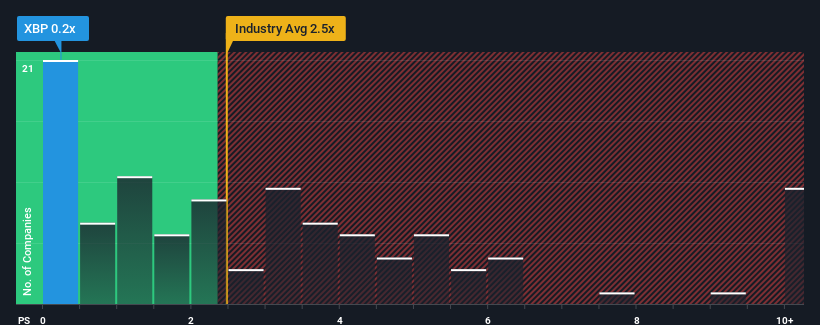
Since its price has dipped substantially, XBP Europe Holdings may look like a strong buying opportunity at present with its price-to-sales (or "P/S") ratio of 0.2x, considering almost half of all companies in the Diversified Financial industry in the United States have P/S ratios greater than 2.5x and even P/S higher than 5x aren't out of the ordinary. However, the P/S might be quite low for a reason and it requires further investigation to determine if it's justified.
What Does XBP Europe Holdings' Recent Performance Look Like?
For example, consider that XBP Europe Holdings' financial performance has been poor lately as its revenue has been in decline. One possibility is that the P/S is low because investors think the company won't do enough to avoid underperforming the broader industry in the near future. If you like the company, you'd be hoping this isn't the case so that you could potentially pick up some stock while it's out of favour.
We don't have analyst forecasts, but you can see how recent trends are setting up the company for the future by checking out our free report on XBP Europe Holdings' earnings, revenue and cash flow.What Are Revenue Growth Metrics Telling Us About The Low P/S?
There's an inherent assumption that a company should far underperform the industry for P/S ratios like XBP Europe Holdings' to be considered reasonable.
In reviewing the last year of financials, we were disheartened to see the company's revenues fell to the tune of 7.7%. This means it has also seen a slide in revenue over the longer-term as revenue is down 23% in total over the last three years. Accordingly, shareholders would have felt downbeat about the medium-term rates of revenue growth.
Comparing that to the industry, which is predicted to deliver 1.5% growth in the next 12 months, the company's downward momentum based on recent medium-term revenue results is a sobering picture.
With this in mind, we understand why XBP Europe Holdings' P/S is lower than most of its industry peers. Nonetheless, there's no guarantee the P/S has reached a floor yet with revenue going in reverse. Even just maintaining these prices could be difficult to achieve as recent revenue trends are already weighing down the shares.
The Key Takeaway
Shares in XBP Europe Holdings have plummeted and its P/S has followed suit. While the price-to-sales ratio shouldn't be the defining factor in whether you buy a stock or not, it's quite a capable barometer of revenue expectations.
Our examination of XBP Europe Holdings confirms that the company's shrinking revenue over the past medium-term is a key factor in its low price-to-sales ratio, given the industry is projected to grow. Right now shareholders are accepting the low P/S as they concede future revenue probably won't provide any pleasant surprises either. Given the current circumstances, it seems unlikely that the share price will experience any significant movement in either direction in the near future if recent medium-term revenue trends persist.
It's always necessary to consider the ever-present spectre of investment risk. We've identified 6 warning signs with XBP Europe Holdings (at least 5 which don't sit too well with us), and understanding these should be part of your investment process.
If you're unsure about the strength of XBP Europe Holdings' business, why not explore our interactive list of stocks with solid business fundamentals for some other companies you may have missed.
Have feedback on this article? Concerned about the content? Get in touch with us directly. Alternatively, email editorial-team (at) simplywallst.com.
This article by Simply Wall St is general in nature. We provide commentary based on historical data and analyst forecasts only using an unbiased methodology and our articles are not intended to be financial advice. It does not constitute a recommendation to buy or sell any stock, and does not take account of your objectives, or your financial situation. We aim to bring you long-term focused analysis driven by fundamental data. Note that our analysis may not factor in the latest price-sensitive company announcements or qualitative material. Simply Wall St has no position in any stocks mentioned.