
Does UOL Group (SGX:U14) Have A Healthy Balance Sheet?
Does UOL Group (SGX:U14) Have A Healthy Balance Sheet?
Warren Buffett famously said, 'Volatility is far from synonymous with risk.' When we think about how risky a company is, we always like to look at its use of debt, since debt overload can lead to ruin. We note that UOL Group Limited (SGX:U14) does have debt on its balance sheet. But is this debt a concern to shareholders?
禾倫·巴菲特曾說過一句名言:“波動性遠非風險的代名詞。”當我們思考一家公司的風險有多大時,我們總是喜歡考慮其債務的用途,因爲債務過載可能導致破產。我們注意到,UOL集團有限公司(新加坡證券交易所股票代碼:U14)的資產負債表上確實有債務。但是這筆債務是股東關心的問題嗎?
Why Does Debt Bring Risk?
爲什麼債務會帶來風險?
Debt is a tool to help businesses grow, but if a business is incapable of paying off its lenders, then it exists at their mercy. Ultimately, if the company can't fulfill its legal obligations to repay debt, shareholders could walk away with nothing. While that is not too common, we often do see indebted companies permanently diluting shareholders because lenders force them to raise capital at a distressed price. Of course, the upside of debt is that it often represents cheap capital, especially when it replaces dilution in a company with the ability to reinvest at high rates of return. When we think about a company's use of debt, we first look at cash and debt together.
債務是幫助企業發展的工具,但如果企業無法還清貸款人,那麼債務就任由他們擺佈。歸根結底,如果公司無法履行償還債務的法律義務,股東可能一無所有地離開。儘管這種情況並不常見,但我們經常會看到負債公司永久稀釋股東,因爲貸款人強迫他們以不利的價格籌集資金。當然,債務的好處在於它通常代表廉價資本,尤其是當它取代了對一家能夠以高回報率進行再投資的公司的攤薄時。當我們考慮公司使用債務時,我們首先要同時考慮現金和債務。
What Is UOL Group's Net Debt?
UOL 集團的淨負債是多少?
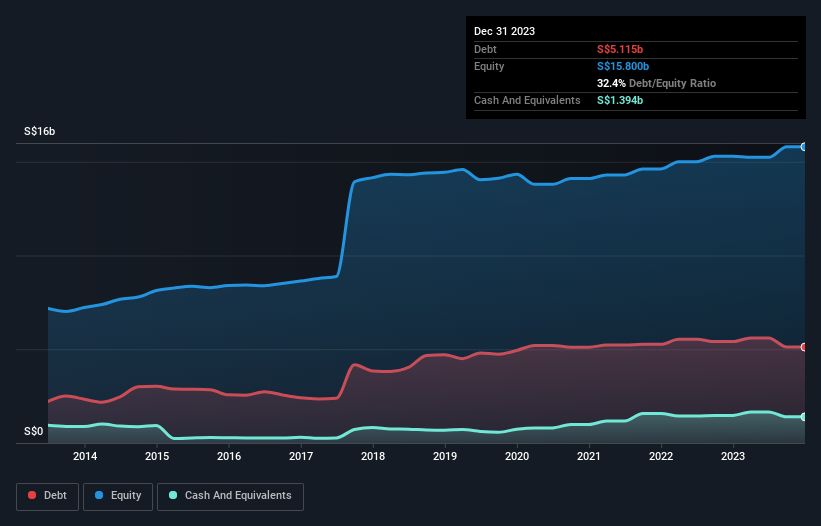
As you can see below, UOL Group had S$5.12b of debt at December 2023, down from S$5.41b a year prior. However, it also had S$1.39b in cash, and so its net debt is S$3.72b.
如下所示,截至2023年12月,UOL集團的債務爲51.2億新元,低於去年同期的54.1億新元。但是,它也有13.9億新元的現金,因此其淨負債爲37.2億新元。
How Healthy Is UOL Group's Balance Sheet?
UOL 集團的資產負債表有多健康?
The latest balance sheet data shows that UOL Group had liabilities of S$1.53b due within a year, and liabilities of S$4.87b falling due after that. On the other hand, it had cash of S$1.39b and S$3.30b worth of receivables due within a year. So it has liabilities totalling S$1.70b more than its cash and near-term receivables, combined.
最新的資產負債表數據顯示,UOL集團的負債爲15.3億新元,此後到期的負債爲48.7億新元。另一方面,它有13.9億新元的現金和價值33.0億新元的應收賬款在一年內到期。因此,它的負債總額比其現金和短期應收賬款的總和多出17.0億新元。
UOL Group has a market capitalization of S$4.95b, so it could very likely raise cash to ameliorate its balance sheet, if the need arose. However, it is still worthwhile taking a close look at its ability to pay off debt.
UOL Group的市值爲49.5億新元,因此,如果需要,它很可能會籌集資金以改善其資產負債表。但是,仍然值得仔細研究其償還債務的能力。
We measure a company's debt load relative to its earnings power by looking at its net debt divided by its earnings before interest, tax, depreciation, and amortization (EBITDA) and by calculating how easily its earnings before interest and tax (EBIT) cover its interest expense (interest cover). The advantage of this approach is that we take into account both the absolute quantum of debt (with net debt to EBITDA) and the actual interest expenses associated with that debt (with its interest cover ratio).
我們通過以下方法來衡量公司的債務負擔與其盈利能力:將其淨負債除以利息、稅項、折舊和攤銷前的收益(EBITDA),並計算其利息和稅前收益(EBIT)支付利息支出(利息保障)的難易程度。這種方法的優勢在於,我們既考慮了債務的絕對數量(包括淨負債與息稅折舊攤銷前利潤),也考慮了與該債務相關的實際利息支出(及其利息覆蓋率)。
UOL Group has a debt to EBITDA ratio of 4.9 and its EBIT covered its interest expense 4.1 times. Taken together this implies that, while we wouldn't want to see debt levels rise, we think it can handle its current leverage. More concerning, UOL Group saw its EBIT drop by 7.3% in the last twelve months. If that earnings trend continues the company will face an uphill battle to pay off its debt. There's no doubt that we learn most about debt from the balance sheet. But ultimately the future profitability of the business will decide if UOL Group can strengthen its balance sheet over time. So if you're focused on the future you can check out this free report showing analyst profit forecasts.
UOL集團的債務與息稅折舊攤銷前利潤的比率爲4.9,其息稅前利潤覆蓋了利息支出的4.1倍。綜上所述,這意味着,儘管我們不希望債務水平上升,但我們認爲它可以承受目前的槓桿率。更令人擔憂的是,UOL集團的息稅前利潤在過去十二個月中下降了7.3%。如果這種收益趨勢持續下去,該公司在償還債務方面將面臨一場艱苦的鬥爭。毫無疑問,我們從資產負債表中學到的關於債務的知識最多。但最終,該業務的未來盈利能力將決定UOL Group能否隨着時間的推移加強其資產負債表。因此,如果您專注於未來,可以查看這份顯示分析師利潤預測的免費報告。
Finally, a company can only pay off debt with cold hard cash, not accounting profits. So the logical step is to look at the proportion of that EBIT that is matched by actual free cash flow. Looking at the most recent three years, UOL Group recorded free cash flow of 40% of its EBIT, which is weaker than we'd expect. That's not great, when it comes to paying down debt.
最後,公司只能用冷硬現金償還債務,不能用會計利潤償還債務。因此,合乎邏輯的步驟是研究息稅前利潤與實際自由現金流相匹配的比例。縱觀最近三年,UOL集團的自由現金流佔其息稅前利潤的40%,低於我們的預期。在償還債務方面,這並不好。
Our View
我們的觀點
UOL Group's net debt to EBITDA was a real negative on this analysis, although the other factors we considered cast it in a significantly better light. For example, its level of total liabilities is relatively strong. When we consider all the factors discussed, it seems to us that UOL Group is taking some risks with its use of debt. So while that leverage does boost returns on equity, we wouldn't really want to see it increase from here. When analysing debt levels, the balance sheet is the obvious place to start. However, not all investment risk resides within the balance sheet - far from it. For example UOL Group has 2 warning signs (and 1 which can't be ignored) we think you should know about.
儘管我們考慮的其他因素使其好得多,但UOL集團的淨負債佔息稅折舊攤銷前利潤的比例確實爲負數。例如,其總負債水平相對較高。當我們考慮所討論的所有因素時,在我們看來,UOL Group在使用債務方面正在冒一些風險。因此,儘管這種槓桿率確實提高了股本回報率,但我們真的不希望看到它從現在開始增加。在分析債務水平時,資產負債表是顯而易見的起點。但是,並非所有的投資風險都存在於資產負債表中,遠非如此。例如,UOL Group 有 2 個警告標誌(以及 1 個不可忽視的),我們認爲您應該知道。
If, after all that, you're more interested in a fast growing company with a rock-solid balance sheet, then check out our list of net cash growth stocks without delay.
畢竟,如果你對一家資產負債表堅如磐石的快速成長型公司更感興趣,那麼請立即查看我們的淨現金增長股票清單。
Have feedback on this article? Concerned about the content? Get in touch with us directly. Alternatively, email editorial-team (at) simplywallst.com.
This article by Simply Wall St is general in nature. We provide commentary based on historical data and analyst forecasts only using an unbiased methodology and our articles are not intended to be financial advice. It does not constitute a recommendation to buy or sell any stock, and does not take account of your objectives, or your financial situation. We aim to bring you long-term focused analysis driven by fundamental data. Note that our analysis may not factor in the latest price-sensitive company announcements or qualitative material. Simply Wall St has no position in any stocks mentioned.
對這篇文章有反饋嗎?對內容感到擔憂?直接聯繫我們。 或者,給編輯團隊 (at) simplywallst.com 發送電子郵件。
Simply Wall St的這篇文章本質上是籠統的。我們僅使用公正的方法根據歷史數據和分析師的預測提供評論,我們的文章無意作爲財務建議。它不構成買入或賣出任何股票的建議,也沒有考慮到您的目標或財務狀況。我們的目標是爲您提供由基本數據驅動的長期重點分析。請注意,我們的分析可能不考慮最新的價格敏感型公司公告或定性材料。簡而言之,華爾街沒有持有任何上述股票的頭寸。
譯文內容由第三人軟體翻譯。