
 Yahoo Finance
 TransUnion (TRU) Stock Barely Moves Despite Q1 Earnings Beat

TransUnion TRU reported impressive first-quarter 2024 results, wherein earnings and revenues beat the Zacks Consensus Estimate.
The stock has barely moved since the earnings release on Apr 25 in response to better-than-expected earnings and impressive guidance.
For 2024, TransUnion expects revenues between $4.02 billion and $4.08 billion compared with $3.96-$4.02 billion stated previously. The Zacks Consensus Estimate of $4.03 billion is lower than the mid-point ($4.04 billion) of the company’s guided range.
TRU anticipates adjusted earnings per share (EPS) of $3.69-$3.86 compared with $3.57-$3.74 mentioned previously. The consensus estimate for the same is pegged at $3.74, which is lower than the midpoint ($3.78) of the company’s guided range.
TRU’s quarterly adjusted earnings (adjusting 59 cents from non-recurring items) of 92 cents per share surpassed the consensus mark by 13.6% and grew 15% year over year. Total revenues of $1 billion surpassed the consensus mark by 4.5% and increased 8.6% from the year-ago quarter.
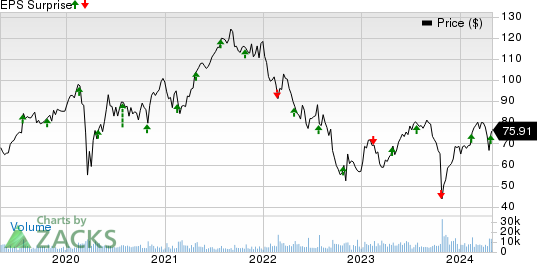
The company’s stock has surged 73% over the past six months, outperforming the 14.7% rally of the industry it belongs to and 22.2% growth of the Zacks S&P 500 Composite.
TransUnion Price and EPS Surprise
TransUnion price-eps-surprise | TransUnion Quote
Revenues by Segments
The U.S. Markets segment’s revenues of $789 million were up 7% year over year and surpassed our estimate of $632.6 million. Within the segment, Financial Services’ revenues of $352 million showed an increase of 13% from the year-ago quarter. Emerging Vertical revenues were $298 million, which increased 4% year over year. Consumer Interactive revenues were $139 million, down 2% from first-quarter 2023.
The International segment’s revenues increased 16% year over year on a reported basis and 15% on a constant-currency basis to $236 million and surpassed our estimate of $218.2 million. Revenues from Canada increased 19% year over year on a reported basis and 18% year over year on a constant-currency basis to $36 million, beating our estimate of $34.2 million.
Revenues from India increased 30% on a reported basis and 31% on a constant-currency basis to $71 million and beat our estimated $68.7 million. Revenues from the Asia-Pacific were $25 million, up 17% on both reported and constant-currency basis, beating our estimate of $24.3 million.
Revenues from Latin America increased 14% on a reported basis and 7% on a constant-currency basis to $33 million and beat our estimate of $30.6 million. Revenues from Africa increased 3% on a reported basis and 12% on a constant-currency basis to $15 million, surpassing our estimate of $14.3 million. Revenues from the U.K. were $54 million, up 4% on both reported and constant-currency basis, surpassing our estimate of $46.1 million.
The Consumer Interactive segment’s revenues of $139.3 million decreased 2.1% year over year on a reported basis and missed our estimate of $141.1 million.
Operating Performance
Adjusted EBITDA was $358 million, marking a year-over-year increase of 11% on both reported and constant-currency basis. The reported figure beat our estimate of 324.9 million. The adjusted EBITDA margin was 35.1%, 80 basis points higher than the year-ago figure.
Balance Sheet & Cash Flow
TransUnion had $434 million in cash and cash equivalents at the end of the quarter compared with $476 million at the end of the prior quarter. The long-term debt was $5.3 billion, flat with the previous quarter.
Cash generated from operating activities during the quarter was $54 million. Capital expenditure was $62.4 million.
Q2 & 2024 Outlook
For the second quarter of 2024, TransUnion expects revenues between $1.017 billion and $1.026 billion. The mid-point ($1.02 billion) of the company’s guided range is the same as the current Zacks Consensus Estimate.
TRU anticipates adjusted EPS of 95-98 cents. The consensus estimate for the same is 91 cents lower than the company’s guided range. Adjusted EBITDA is anticipated between $366 million and $372 million.
For 2024, adjusted EBITDA is expected between $1.433 billion and $1.475 billion compared with $1.39-$1.44 billion mentioned previously.
TRU currently carries a Zacks Rank #3 (Hold). You can see the complete list of today’s Zacks #1 Rank (Strong Buy) stocks here.
Earnings Snapshot
Equifax Inc. EFX reported mixed first-quarter 2024 results.
EFX’s adjusted earnings (excluding 50 cents from non-recurring items) were $1.5 per share, beating the Zacks Consensus Estimate by 4.2% and increasing 4.9% from the year-ago quarter. Total revenues of $1.4 billion missed the consensus estimate by a slight margin but increased 6.7% from the year-ago quarter.
Waste Management Inc. WM reported mixed first-quarter 2024 results.
WM’s adjusted EPS of $1.8 surpassed the Zacks Consensus Estimate by 15.1% and improved 33.6% year over year. Total revenues of $5.2 billion missed the consensus estimate by a slight margin but increased 5.5% year over year.
Want the latest recommendations from Zacks Investment Research? Today, you can download 7 Best Stocks for the Next 30 Days. Click to get this free report
Equifax, Inc. (EFX) : Free Stock Analysis Report
Waste Management, Inc. (WM) : Free Stock Analysis Report
TransUnion (TRU) : Free Stock Analysis Report
