
Calumet Specialty Products Partners (NASDAQ:CLMT) Delivers Shareholders Enviable 34% CAGR Over 5 Years, Surging 4.3% in the Last Week Alone
Calumet Specialty Products Partners (NASDAQ:CLMT) Delivers Shareholders Enviable 34% CAGR Over 5 Years, Surging 4.3% in the Last Week Alone
Long term investing can be life changing when you buy and hold the truly great businesses. And highest quality companies can see their share prices grow by huge amounts. Don't believe it? Then look at the Calumet Specialty Products Partners, L.P. (NASDAQ:CLMT) share price. It's 339% higher than it was five years ago. This just goes to show the value creation that some businesses can achieve. Meanwhile the share price is 4.3% higher than it was a week ago.
當您購買並持有真正優秀的企業時,長期投資可以改變生活。最高質量的公司可以看到其股價大幅上漲。不相信?然後看看Calumet Specialty Products Partners, L.P.(納斯達克股票代碼:CLMT)的股價。它比五年前高出339%。這只是表明一些企業可以實現的價值創造。同時,股價比一週前上漲了4.3%。
On the back of a solid 7-day performance, let's check what role the company's fundamentals have played in driving long term shareholder returns.
在連續7天表現穩健的背景下,讓我們來看看公司的基本面在推動長期股東回報方面發揮了什麼作用。
To paraphrase Benjamin Graham: Over the short term the market is a voting machine, but over the long term it's a weighing machine. One flawed but reasonable way to assess how sentiment around a company has changed is to compare the earnings per share (EPS) with the share price.
用本傑明·格雷厄姆的話來說:從短期來看,市場是一臺投票機器,但從長遠來看,它是一臺稱重機。評估公司情緒變化的一種有缺陷但合理的方法是將每股收益(EPS)與股價進行比較。
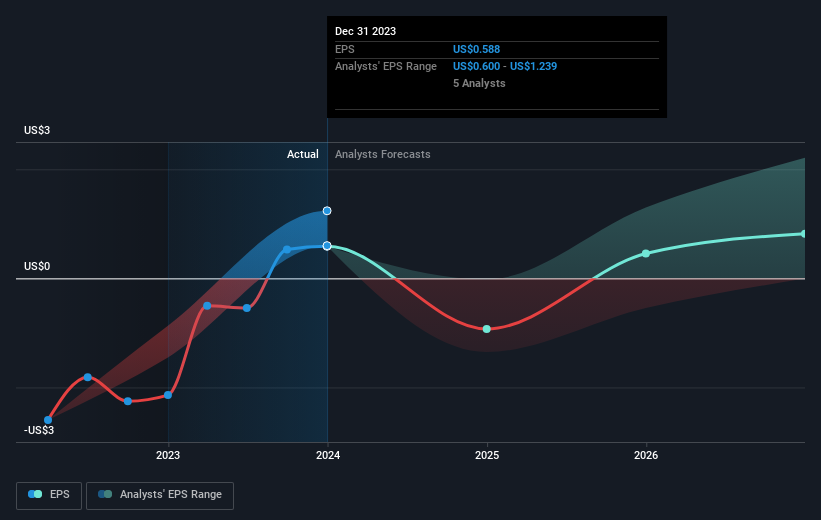
During the five years of share price growth, Calumet Specialty Products Partners moved from a loss to profitability. Sometimes, the start of profitability is a major inflection point that can signal fast earnings growth to come, which in turn justifies very strong share price gains.
在股價增長的五年中,Calumet特種產品合作伙伴從虧損轉爲盈利。有時,盈利能力的開始是一個重要的轉折點,這可能預示着收益的快速增長,這反過來又證明了股價的強勁上漲是合理的。
You can see below how EPS has changed over time (discover the exact values by clicking on the image).
你可以在下面看到 EPS 是如何隨着時間的推移而變化的(點擊圖片發現確切的值)。
We like that insiders have been buying shares in the last twelve months. Having said that, most people consider earnings and revenue growth trends to be a more meaningful guide to the business. It might be well worthwhile taking a look at our free report on Calumet Specialty Products Partners' earnings, revenue and cash flow.
像我們一樣,內部人士在過去的十二個月中一直在購買股票。話雖如此,大多數人認爲收益和收入增長趨勢是更有意義的業務指南。可能值得一看我們關於Calumet特種產品合作伙伴的收益、收入和現金流的免費報告。
A Different Perspective
不同的視角
While the broader market gained around 25% in the last year, Calumet Specialty Products Partners shareholders lost 6.8%. However, keep in mind that even the best stocks will sometimes underperform the market over a twelve month period. Longer term investors wouldn't be so upset, since they would have made 34%, each year, over five years. It could be that the recent sell-off is an opportunity, so it may be worth checking the fundamental data for signs of a long term growth trend. It's always interesting to track share price performance over the longer term. But to understand Calumet Specialty Products Partners better, we need to consider many other factors. Like risks, for instance. Every company has them, and we've spotted 3 warning signs for Calumet Specialty Products Partners (of which 2 are a bit concerning!) you should know about.
儘管去年整體市場上漲了約25%,但Calumet Specialty Products Partners的股東卻下跌了6.8%。但是,請記住,即使是最好的股票有時也會在十二個月內表現不如市場。長期投資者不會那麼沮喪,因爲他們將在五年內每年賺取34%的收入。最近的拋售可能是一個機會,因此可能值得查看基本面數據以尋找長期增長趨勢的跡象。長期跟蹤股價表現總是很有意思的。但是,爲了更好地了解 Calumet 特種產品合作伙伴,我們需要考慮許多其他因素。比如風險。每家公司都有,我們發現了 Calumet 特種產品合作伙伴的 3 個警告信號(其中 2 個有點令人擔憂!)你應該知道。
If you like to buy stocks alongside management, then you might just love this free list of companies. (Hint: insiders have been buying them).
如果你想與管理層一起購買股票,那麼你可能會喜歡這份免費的公司名單。(提示:業內人士一直在購買它們)。
Please note, the market returns quoted in this article reflect the market weighted average returns of stocks that currently trade on American exchanges.
請注意,本文引用的市場回報反映了目前在美國交易所交易的股票的市場加權平均回報。
Have feedback on this article? Concerned about the content? Get in touch with us directly. Alternatively, email editorial-team (at) simplywallst.com.
This article by Simply Wall St is general in nature. We provide commentary based on historical data and analyst forecasts only using an unbiased methodology and our articles are not intended to be financial advice. It does not constitute a recommendation to buy or sell any stock, and does not take account of your objectives, or your financial situation. We aim to bring you long-term focused analysis driven by fundamental data. Note that our analysis may not factor in the latest price-sensitive company announcements or qualitative material. Simply Wall St has no position in any stocks mentioned.
對這篇文章有反饋嗎?對內容感到擔憂?直接聯繫我們。 或者,給編輯團隊 (at) simplywallst.com 發送電子郵件。
Simply Wall St的這篇文章本質上是籠統的。我們僅使用公正的方法根據歷史數據和分析師的預測提供評論,我們的文章無意作爲財務建議。它不構成買入或賣出任何股票的建議,也沒有考慮到您的目標或財務狀況。我們的目標是爲您提供由基本數據驅動的長期重點分析。請注意,我們的分析可能不考慮最新的價格敏感型公司公告或定性材料。簡而言之,華爾街沒有持有任何上述股票的頭寸。
譯文內容由第三人軟體翻譯。