
As an investor its worth striving to ensure your overall portfolio beats the market average. But in any portfolio, there are likely to be some stocks that fall short of that benchmark. We regret to report that long term KTK Group Co., Ltd. (SHSE:603680) shareholders have had that experience, with the share price dropping 39% in three years, versus a market decline of about 17%. On the other hand the share price has bounced 7.8% over the last week. Less than a week ago KTK Group announced its financial results; you can catch up on the most recent data by reading our company report.
On a more encouraging note the company has added CN¥455m to its market cap in just the last 7 days, so let's see if we can determine what's driven the three-year loss for shareholders.
There is no denying that markets are sometimes efficient, but prices do not always reflect underlying business performance. By comparing earnings per share (EPS) and share price changes over time, we can get a feel for how investor attitudes to a company have morphed over time.
KTK Group saw its EPS decline at a compound rate of 13% per year, over the last three years. This fall in EPS isn't far from the rate of share price decline, which was 15% per year. So it seems that investor expectations of the company are staying pretty steady, despite the disappointment. Rather, the share price has approximately tracked EPS growth.
You can see below how EPS has changed over time (discover the exact values by clicking on the image).
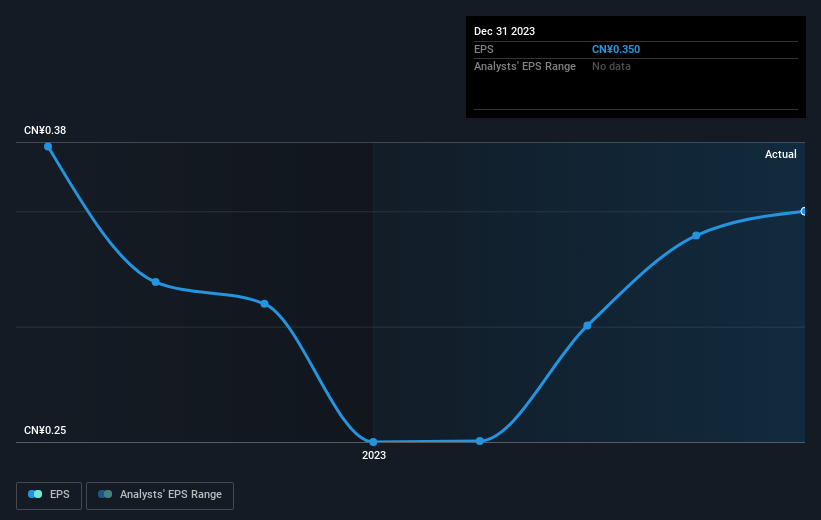
Before buying or selling a stock, we always recommend a close examination of historic growth trends, available here.
What About Dividends?
When looking at investment returns, it is important to consider the difference between total shareholder return (TSR) and share price return. The TSR incorporates the value of any spin-offs or discounted capital raisings, along with any dividends, based on the assumption that the dividends are reinvested. So for companies that pay a generous dividend, the TSR is often a lot higher than the share price return. As it happens, KTK Group's TSR for the last 3 years was -36%, which exceeds the share price return mentioned earlier. The dividends paid by the company have thusly boosted the total shareholder return.
A Different Perspective
While it's never nice to take a loss, KTK Group shareholders can take comfort that , including dividends,their trailing twelve month loss of 10% wasn't as bad as the market loss of around 13%. Unfortunately, last year's performance may indicate unresolved challenges, given that it's worse than the annualised loss of 5% over the last half decade. While some investors do well specializing in buying companies that are struggling (but nonetheless undervalued), don't forget that Buffett said that 'turnarounds seldom turn'. It's always interesting to track share price performance over the longer term. But to understand KTK Group better, we need to consider many other factors. Take risks, for example - KTK Group has 2 warning signs (and 1 which can't be ignored) we think you should know about.
If you are like me, then you will not want to miss this free list of growing companies that insiders are buying.
Please note, the market returns quoted in this article reflect the market weighted average returns of stocks that currently trade on Chinese exchanges.
Have feedback on this article? Concerned about the content? Get in touch with us directly. Alternatively, email editorial-team (at) simplywallst.com.
This article by Simply Wall St is general in nature. We provide commentary based on historical data and analyst forecasts only using an unbiased methodology and our articles are not intended to be financial advice. It does not constitute a recommendation to buy or sell any stock, and does not take account of your objectives, or your financial situation. We aim to bring you long-term focused analysis driven by fundamental data. Note that our analysis may not factor in the latest price-sensitive company announcements or qualitative material. Simply Wall St has no position in any stocks mentioned.