
W. R. Berkley (NYSE:WRB) has had a rough month with its share price down 13%. But if you pay close attention, you might gather that its strong financials could mean that the stock could potentially see an increase in value in the long-term, given how markets usually reward companies with good financial health. Particularly, we will be paying attention to W. R. Berkley's ROE today.
Return on equity or ROE is a key measure used to assess how efficiently a company's management is utilizing the company's capital. In simpler terms, it measures the profitability of a company in relation to shareholder's equity.
How To Calculate Return On Equity?
ROE can be calculated by using the formula:
Return on Equity = Net Profit (from continuing operations) ÷ Shareholders' Equity
So, based on the above formula, the ROE for W. R. Berkley is:
20% = US$1.5b ÷ US$7.5b (Based on the trailing twelve months to March 2024).
The 'return' is the income the business earned over the last year. Another way to think of that is that for every $1 worth of equity, the company was able to earn $0.20 in profit.
What Is The Relationship Between ROE And Earnings Growth?
We have already established that ROE serves as an efficient profit-generating gauge for a company's future earnings. Depending on how much of these profits the company reinvests or "retains", and how effectively it does so, we are then able to assess a company's earnings growth potential. Generally speaking, other things being equal, firms with a high return on equity and profit retention, have a higher growth rate than firms that don't share these attributes.
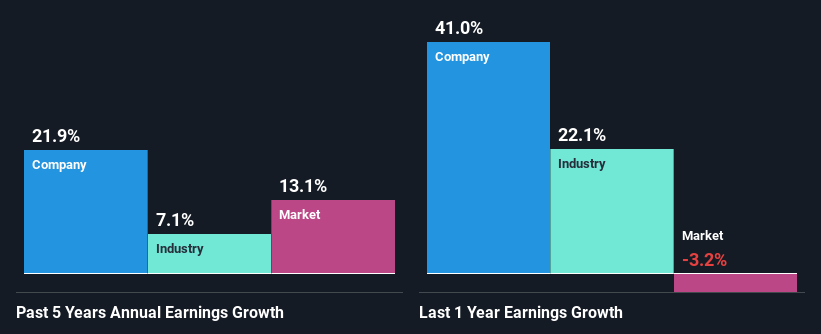
A Side By Side comparison of W. R. Berkley's Earnings Growth And 20% ROE
To start with, W. R. Berkley's ROE looks acceptable. Further, the company's ROE compares quite favorably to the industry average of 13%. This certainly adds some context to W. R. Berkley's exceptional 22% net income growth seen over the past five years. We reckon that there could also be other factors at play here. For example, it is possible that the company's management has made some good strategic decisions, or that the company has a low payout ratio.
We then compared W. R. Berkley's net income growth with the industry and we're pleased to see that the company's growth figure is higher when compared with the industry which has a growth rate of 7.1% in the same 5-year period.
Earnings growth is an important metric to consider when valuing a stock. What investors need to determine next is if the expected earnings growth, or the lack of it, is already built into the share price. Doing so will help them establish if the stock's future looks promising or ominous. If you're wondering about W. R. Berkley's's valuation, check out this gauge of its price-to-earnings ratio, as compared to its industry.
Is W. R. Berkley Making Efficient Use Of Its Profits?
W. R. Berkley's ' three-year median payout ratio is on the lower side at 8.4% implying that it is retaining a higher percentage (92%) of its profits. So it looks like W. R. Berkley is reinvesting profits heavily to grow its business, which shows in its earnings growth.
Moreover, W. R. Berkley is determined to keep sharing its profits with shareholders which we infer from its long history of paying a dividend for at least ten years. Looking at the current analyst consensus data, we can see that the company's future payout ratio is expected to rise to 28% over the next three years. Despite the higher expected payout ratio, the company's ROE is not expected to change by much.
Conclusion
In total, we are pretty happy with W. R. Berkley's performance. Particularly, we like that the company is reinvesting heavily into its business, and at a high rate of return. Unsurprisingly, this has led to an impressive earnings growth. With that said, the latest industry analyst forecasts reveal that the company's earnings growth is expected to slow down. To know more about the company's future earnings growth forecasts take a look at this free report on analyst forecasts for the company to find out more.
Have feedback on this article? Concerned about the content? Get in touch with us directly. Alternatively, email editorial-team (at) simplywallst.com.
This article by Simply Wall St is general in nature. We provide commentary based on historical data and analyst forecasts only using an unbiased methodology and our articles are not intended to be financial advice. It does not constitute a recommendation to buy or sell any stock, and does not take account of your objectives, or your financial situation. We aim to bring you long-term focused analysis driven by fundamental data. Note that our analysis may not factor in the latest price-sensitive company announcements or qualitative material. Simply Wall St has no position in any stocks mentioned.