
Investing in CorVel (NASDAQ:CRVL) Five Years Ago Would Have Delivered You a 230% Gain
Investing in CorVel (NASDAQ:CRVL) Five Years Ago Would Have Delivered You a 230% Gain
The most you can lose on any stock (assuming you don't use leverage) is 100% of your money. But on a lighter note, a good company can see its share price rise well over 100%. One great example is CorVel Corporation (NASDAQ:CRVL) which saw its share price drive 230% higher over five years. In contrast, the stock has fallen 9.2% in the last 30 days. This could be related to the soft market, with stocks down around 3.0% in the last month.
任何股票(假設你不使用槓桿)的最大損失是你的資金的100%。但簡而言之,一家好的公司的股價可以上漲超過100%。一個很好的例子是CorVel公司(納斯達克股票代碼:CRVL),其股價在五年內上漲了230%。相比之下,該股在過去30天中下跌了9.2%。這可能與疲軟的市場有關,上個月股市下跌了約3.0%。
With that in mind, it's worth seeing if the company's underlying fundamentals have been the driver of long term performance, or if there are some discrepancies.
考慮到這一點,值得一看公司的基本面是否是長期業績的驅動力,或者是否存在一些差異。
While the efficient markets hypothesis continues to be taught by some, it has been proven that markets are over-reactive dynamic systems, and investors are not always rational. By comparing earnings per share (EPS) and share price changes over time, we can get a feel for how investor attitudes to a company have morphed over time.
儘管一些人繼續教導高效市場假說,但事實證明,市場是反應過度的動態系統,投資者並不總是理性的。通過比較每股收益(EPS)和一段時間內的股價變化,我們可以了解投資者對公司的態度是如何隨着時間的推移而變化的。
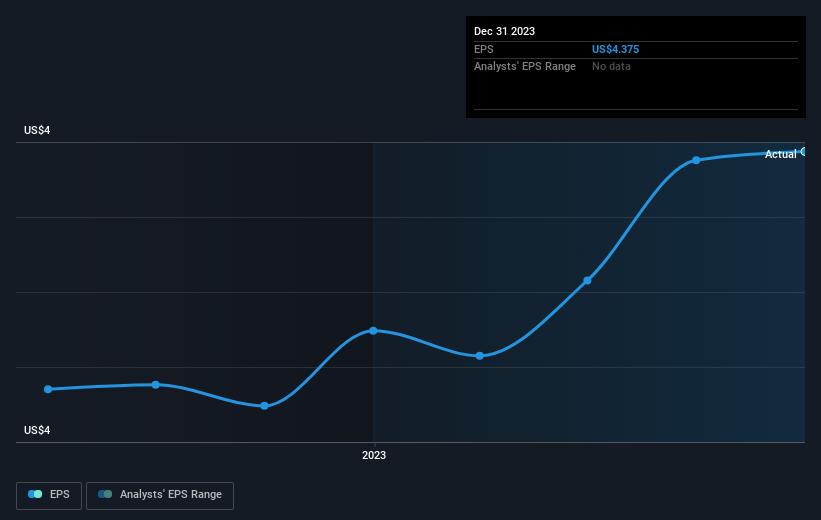
During five years of share price growth, CorVel achieved compound earnings per share (EPS) growth of 14% per year. This EPS growth is slower than the share price growth of 27% per year, over the same period. So it's fair to assume the market has a higher opinion of the business than it did five years ago. And that's hardly shocking given the track record of growth. This favorable sentiment is reflected in its (fairly optimistic) P/E ratio of 54.42.
在五年的股價增長中,CorVel實現了每年14%的複合每股收益(EPS)增長。每股收益的增長低於同期每年27%的股價增長。因此,可以公平地假設市場對該業務的看法比五年前更高。考慮到增長的記錄,這並不令人震驚。這種積極情緒反映在其(相當樂觀的)市盈率爲54.42上。
The graphic below depicts how EPS has changed over time (unveil the exact values by clicking on the image).
下圖描述了 EPS 隨着時間的推移是如何變化的(點擊圖片可以看到確切的值)。
It's probably worth noting that the CEO is paid less than the median at similar sized companies. It's always worth keeping an eye on CEO pay, but a more important question is whether the company will grow earnings throughout the years. It might be well worthwhile taking a look at our free report on CorVel's earnings, revenue and cash flow.
可能值得注意的是,首席執行官的薪水低於類似規模公司的中位數。始終值得關注首席執行官的薪酬,但更重要的問題是公司多年來是否會增加收益。可能值得一看我們關於CorVel收益、收入和現金流的免費報告。
A Different Perspective
不同的視角
CorVel provided a TSR of 17% over the last twelve months. Unfortunately this falls short of the market return. On the bright side, the longer term returns (running at about 27% a year, over half a decade) look better. It's quite possible the business continues to execute with prowess, even as the share price gains are slowing. While it is well worth considering the different impacts that market conditions can have on the share price, there are other factors that are even more important. Take risks, for example - CorVel has 1 warning sign we think you should be aware of.
在過去的十二個月中,CorVel的股東回報率爲17%。不幸的是,這沒有達到市場回報率。好的一面是,長期回報(超過五年,每年約27%)看起來更好。儘管股價上漲放緩,但該業務很有可能繼續保持強勁的執行力。儘管市場狀況可能對股價產生的不同影響值得考慮,但還有其他因素更爲重要。例如,冒險吧——CorVel 有 1 個我們認爲你應該注意的警告信號。
Of course CorVel may not be the best stock to buy. So you may wish to see this free collection of growth stocks.
當然,CorVel可能不是最值得購買的股票。因此,您可能希望看到這批免費的成長股。
Please note, the market returns quoted in this article reflect the market weighted average returns of stocks that currently trade on American exchanges.
請注意,本文引用的市場回報反映了目前在美國交易所交易的股票的市場加權平均回報。
Have feedback on this article? Concerned about the content? Get in touch with us directly. Alternatively, email editorial-team (at) simplywallst.com.
This article by Simply Wall St is general in nature. We provide commentary based on historical data and analyst forecasts only using an unbiased methodology and our articles are not intended to be financial advice. It does not constitute a recommendation to buy or sell any stock, and does not take account of your objectives, or your financial situation. We aim to bring you long-term focused analysis driven by fundamental data. Note that our analysis may not factor in the latest price-sensitive company announcements or qualitative material. Simply Wall St has no position in any stocks mentioned.
對這篇文章有反饋嗎?對內容感到擔憂?直接聯繫我們。 或者,給編輯團隊 (at) simplywallst.com 發送電子郵件。
Simply Wall St的這篇文章本質上是籠統的。我們僅使用公正的方法根據歷史數據和分析師的預測提供評論,我們的文章無意作爲財務建議。它不構成買入或賣出任何股票的建議,也沒有考慮到您的目標或財務狀況。我們的目標是爲您提供由基本數據驅動的長期重點分析。請注意,我們的分析可能不考慮最新的價格敏感型公司公告或定性材料。簡而言之,華爾街沒有持有任何上述股票的頭寸。
譯文內容由第三人軟體翻譯。