
It's easy to match the overall market return by buying an index fund. But if you buy individual stocks, you can do both better or worse than that. Unfortunately the Johnson & Johnson (NYSE:JNJ) share price slid 11% over twelve months. That's well below the market return of 24%. Zooming out, the stock is down 10% in the last three years.
So let's have a look and see if the longer term performance of the company has been in line with the underlying business' progress.
To paraphrase Benjamin Graham: Over the short term the market is a voting machine, but over the long term it's a weighing machine. One way to examine how market sentiment has changed over time is to look at the interaction between a company's share price and its earnings per share (EPS).
During the unfortunate twelve months during which the Johnson & Johnson share price fell, it actually saw its earnings per share (EPS) improve by 58%. It's quite possible that growth expectations may have been unreasonable in the past.
The divergence between the EPS and the share price is quite notable, during the year. So it's well worth checking out some other metrics, too.
On the other hand, we're certainly perturbed by the 11% decline in Johnson & Johnson's revenue. Many investors see falling revenue as a likely precursor to lower earnings, so this could well explain the weak share price.
The image below shows how earnings and revenue have tracked over time (if you click on the image you can see greater detail).
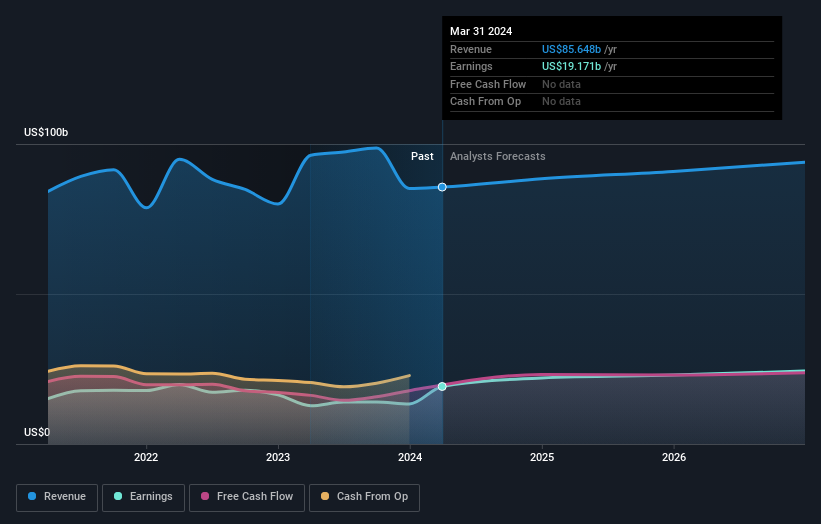
Johnson & Johnson is a well known stock, with plenty of analyst coverage, suggesting some visibility into future growth. So we recommend checking out this free report showing consensus forecasts
What About Dividends?
It is important to consider the total shareholder return, as well as the share price return, for any given stock. The TSR is a return calculation that accounts for the value of cash dividends (assuming that any dividend received was reinvested) and the calculated value of any discounted capital raisings and spin-offs. Arguably, the TSR gives a more comprehensive picture of the return generated by a stock. We note that for Johnson & Johnson the TSR over the last 1 year was -8.0%, which is better than the share price return mentioned above. And there's no prize for guessing that the dividend payments largely explain the divergence!
A Different Perspective
While the broader market gained around 24% in the last year, Johnson & Johnson shareholders lost 8.0% (even including dividends). Even the share prices of good stocks drop sometimes, but we want to see improvements in the fundamental metrics of a business, before getting too interested. Longer term investors wouldn't be so upset, since they would have made 3%, each year, over five years. If the fundamental data continues to indicate long term sustainable growth, the current sell-off could be an opportunity worth considering. While it is well worth considering the different impacts that market conditions can have on the share price, there are other factors that are even more important. To that end, you should be aware of the 1 warning sign we've spotted with Johnson & Johnson .
Of course Johnson & Johnson may not be the best stock to buy. So you may wish to see this free collection of growth stocks.
Please note, the market returns quoted in this article reflect the market weighted average returns of stocks that currently trade on American exchanges.
Have feedback on this article? Concerned about the content? Get in touch with us directly. Alternatively, email editorial-team (at) simplywallst.com.
This article by Simply Wall St is general in nature. We provide commentary based on historical data and analyst forecasts only using an unbiased methodology and our articles are not intended to be financial advice. It does not constitute a recommendation to buy or sell any stock, and does not take account of your objectives, or your financial situation. We aim to bring you long-term focused analysis driven by fundamental data. Note that our analysis may not factor in the latest price-sensitive company announcements or qualitative material. Simply Wall St has no position in any stocks mentioned.