
The most you can lose on any stock (assuming you don't use leverage) is 100% of your money. But on a lighter note, a good company can see its share price rise well over 100%. For instance, the price of Proya Cosmetics Co.,Ltd. (SHSE:603605) stock is up an impressive 240% over the last five years. It's also good to see the share price up 26% over the last quarter. The company reported its financial results recently; you can catch up on the latest numbers by reading our company report.
Since the stock has added CN¥2.2b to its market cap in the past week alone, let's see if underlying performance has been driving long-term returns.
While markets are a powerful pricing mechanism, share prices reflect investor sentiment, not just underlying business performance. One imperfect but simple way to consider how the market perception of a company has shifted is to compare the change in the earnings per share (EPS) with the share price movement.
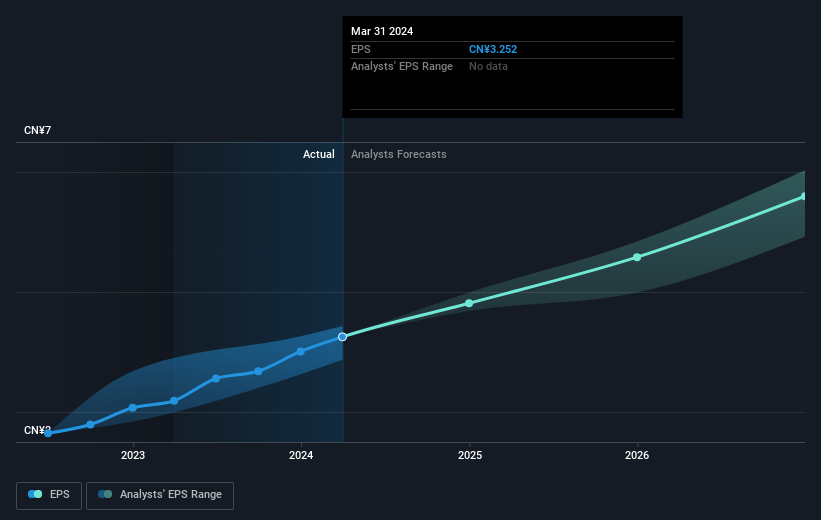
Over half a decade, Proya CosmeticsLtd managed to grow its earnings per share at 33% a year. This EPS growth is reasonably close to the 28% average annual increase in the share price. Therefore one could conclude that sentiment towards the shares hasn't morphed very much. In fact, the share price seems to largely reflect the EPS growth.
The image below shows how EPS has tracked over time (if you click on the image you can see greater detail).
It is of course excellent to see how Proya CosmeticsLtd has grown profits over the years, but the future is more important for shareholders. You can see how its balance sheet has strengthened (or weakened) over time in this free interactive graphic.
What About Dividends?
It is important to consider the total shareholder return, as well as the share price return, for any given stock. Whereas the share price return only reflects the change in the share price, the TSR includes the value of dividends (assuming they were reinvested) and the benefit of any discounted capital raising or spin-off. So for companies that pay a generous dividend, the TSR is often a lot higher than the share price return. We note that for Proya CosmeticsLtd the TSR over the last 5 years was 250%, which is better than the share price return mentioned above. This is largely a result of its dividend payments!
A Different Perspective
While it's never nice to take a loss, Proya CosmeticsLtd shareholders can take comfort that , including dividends,their trailing twelve month loss of 8.2% wasn't as bad as the market loss of around 13%. Longer term investors wouldn't be so upset, since they would have made 28%, each year, over five years. It could be that the business is just facing some short term problems, but shareholders should keep a close eye on the fundamentals. It's always interesting to track share price performance over the longer term. But to understand Proya CosmeticsLtd better, we need to consider many other factors. Consider risks, for instance. Every company has them, and we've spotted 1 warning sign for Proya CosmeticsLtd you should know about.
If you are like me, then you will not want to miss this free list of growing companies that insiders are buying.
Please note, the market returns quoted in this article reflect the market weighted average returns of stocks that currently trade on Chinese exchanges.
Have feedback on this article? Concerned about the content? Get in touch with us directly. Alternatively, email editorial-team (at) simplywallst.com.
This article by Simply Wall St is general in nature. We provide commentary based on historical data and analyst forecasts only using an unbiased methodology and our articles are not intended to be financial advice. It does not constitute a recommendation to buy or sell any stock, and does not take account of your objectives, or your financial situation. We aim to bring you long-term focused analysis driven by fundamental data. Note that our analysis may not factor in the latest price-sensitive company announcements or qualitative material. Simply Wall St has no position in any stocks mentioned.