
FX168 Financial News (Hong Kong) - Stimulated by stronger than expected US core PCE inflation data, the US dollar index rose strongly on Friday (April 26). After the data was released, it hit a high of 106.19, then regained some of its gains. Nicholas Kitonyi, an analyst at the well-known financial website FXDaily Report, wrote an article on Friday analyzing the future trend of the US dollar.
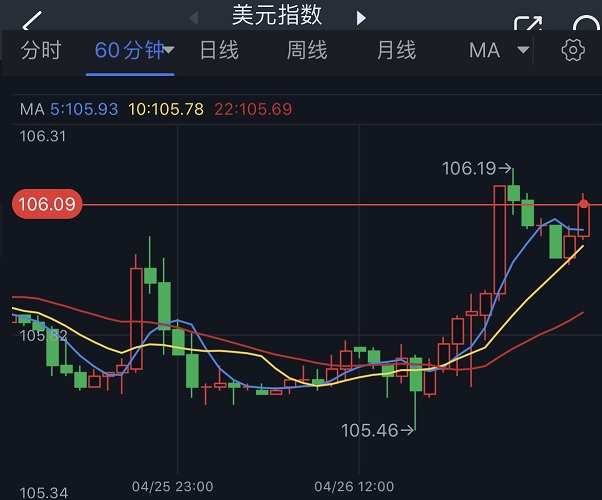
(US Dollar Index 60-minute chart source: FX168)
Kitonyi wrote in the article that after the US data was released, the US dollar index rebounded from a two-week low of around 105.42 to above 106 on Friday. On the 60-minute chart, the US dollar index is trading in an ascending channel.
Kitonyi added that the US dollar index also rose above the 100 hour moving average. The US dollar index retreated somewhat at the end of Friday to avoid a further rebound to the 14-hour overbought level of the relatively strong index.
According to data released by the US on Friday, the US core personal consumption expenditure (PCE) price index rose 2.8% per annum in March, higher than the 2.7% increase expected by the market. Compared with the previous month, core PCE rose 0.3%, in line with Wall Street expectations.
The ICE dollar index, which tracks the dollar against six major currencies, closed up 0.49% at 106.09 on Friday.
Before the US PCE data was released, the US dollar showed an overall decline this week, but after rising on Friday, the US dollar closed basically flat this week.
As the most popular inflation indicator of the Federal Reserve, year-on-year changes in the core PCE price index have a great impact on policy makers.
According to CME Group (CME Group)'s “Federal Reserve Watch” tool, after PCE inflation data was released, the US interest rate futures market believed that the probability of cutting interest rates in September was 58%, down from 68% a week ago, and the probability of easing the policy in December was over 80%.
Two pictures look at the technical prospects of the US dollar
As far as the short-term trend is concerned, Kitonyi said that from a technical point of view, the US dollar index appears to be in a sharp upward channel pattern on the 60-minute trend chart. After rebounding to an overbought state, the 14-hour Relative Strength Index (RSI) also appears to support a short-term bullish trend.
Therefore, dollar bulls will seek to extend the current rally to 106.20 or higher to 106.40. On the other hand, bears will seek a profit settlement when the US dollar index falls back to around 105.79, or even lower to 105.58.
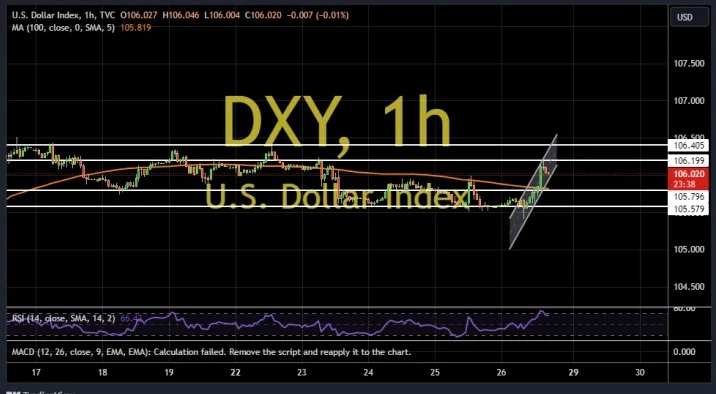
(US Dollar Index 60-minute chart source: FXDailyReport)
Kitonyi pointed out that on the daily chart, the US dollar index appears to be trading in a downward channel. After recovering from an overbought state, the 14-day RSI also appears to support a bearish trend.
As a result, the dollar bears set a long-term profit target of around 105.48, or lower, at 104.95. On the other hand, bulls will seek a rebound in the dollar index to around 106.54, or higher to 107.07.

(US dollar index daily chart source: FXDailyReport)