
#黄金技术分析 #24K99讯 In the Asian market on Friday (April 26), spot gold accelerated its short-term rise. The price of gold has just broken through the 2,335 US dollars/ounce mark. FXStreet chief analyst Valeria Bednarik wrote an article analyzing the technical prospects of gold.
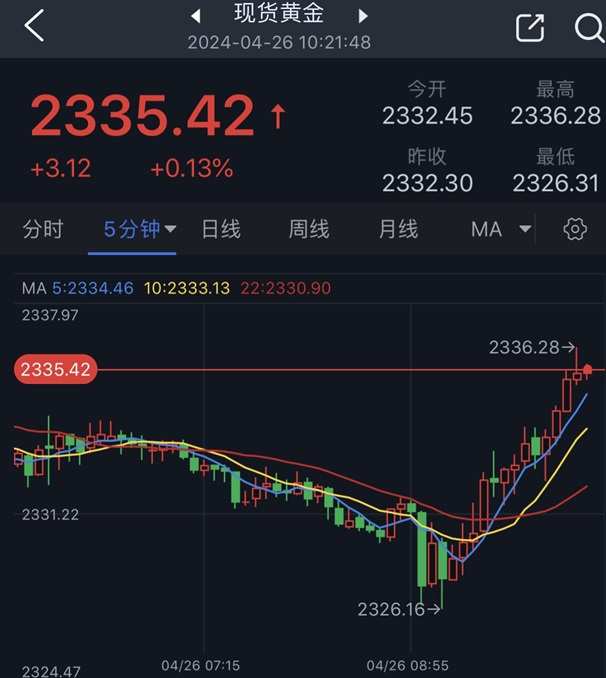
(5 minute chart of spot gold source: 24K99)
Bednarik pointed out that the US GDP data for the first quarter fell short of expectations, causing concern. Gold maintained moderate gains, and the bearish momentum weakened.
The US Bureau of Economic Analysis reported on Thursday that after seasonal adjustments, the US gross domestic product (GDP) grew 1.6% year on year in the first quarter, lower than the increase predicted by economists surveyed by Dow Jones (2.4%).
Spot gold closed higher at $16.49, or 0.71%, to close at $2332.30 per ounce on Thursday.
Analysis of short-term technical prospects for gold
Bednarik said that from a technical perspective, the price of gold is above the 23.6% Fibonacci retracement level of 1996.06 US dollars-2431.43 per ounce. On the daily chart, the bullish 20-day Simple Moving Average (SMA) is near the same level, and the price of gold is trying to extend gains above it. Meanwhile, the longer-term moving average maintained a bullish slope well below the 20-day SMA. Finally, the momentum indicator continued to decline and was around 100; however, the Relative Strength Index (RSI) turned upward within positive levels.
Bednarik added that generally speaking, gold tends to benefit in a risk-averse environment, which biases the trend risk upward. In the short term, according to the 4-hour chart, the price of gold offers a neutral to bullish stance. The momentum indicator is losing upward strength but remains above 100, while the RSI is consolidating around 47, reflecting a lack of clear directional strength. Meanwhile, the moderately bullish 100-period SMA provides dynamic resistance around $2343.50 per ounce, while the 20-period SMA is lower below the current gold price level.
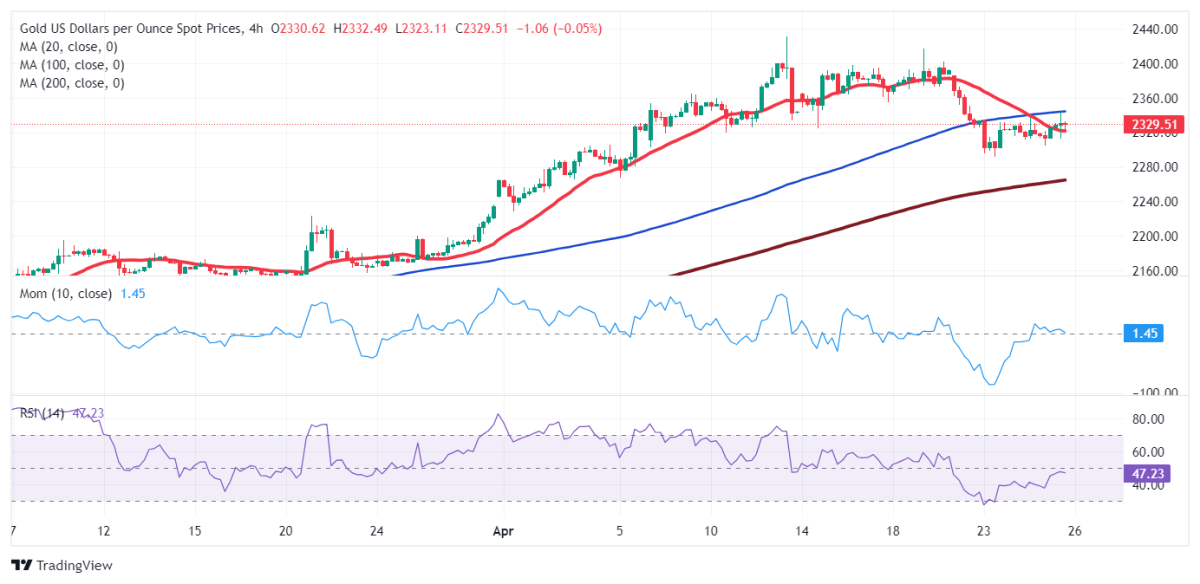
(Spot gold 4-hour chart source: FXStreet)
Bednarik gave the latest important support and resistance levels for gold prices:
Support levels: $2310.00/oz; $2295.20/oz; $2282.90/oz
Resistance levels: $2343.50/oz; $2361.55/oz; $2372.90/oz
At 10:21 Beijing time, spot gold was reported at $2335.42 per ounce.