
#黄金技术分析 #24K99讯 In the Asian market on Thursday (April 25), spot gold suddenly rose rapidly in the short term. The price of gold has just broken through the $2,320 per ounce mark. FXStreet chief analyst Valeria Bednarik wrote an article analyzing the technical prospects of gold.
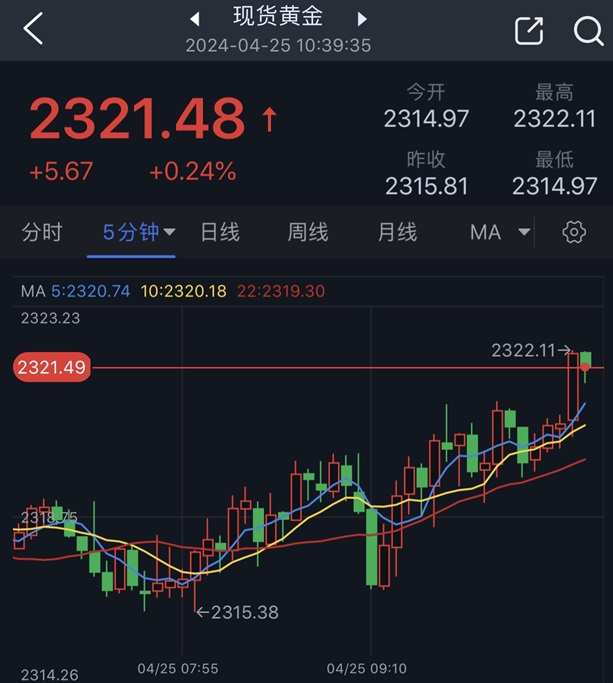
(5 minute chart of spot gold source: 24K99)
Bednarik pointed out that the outlook for gold has recently turned neutral, and the bulls seem unwilling to give up.
Spot gold closed down 0.27% at $2315.81 per ounce on Wednesday.
Bednarik said that on Thursday, the US will announce the initial gross domestic product (GDP) value for the first quarter. The data is expected to show that in the three months ending March, the US economy will grow at an annualized rate of 2.5%.
On Friday, the focus of the gold market will shift to the March personal consumption expenditure (PCE) price index, which is the most popular inflation indicator of the Federal Reserve (Fed).
Analysis of short-term technical prospects for gold
Bednarik said that from the daily gold chart, the price of gold continued to hover near the 23.6% Fibonacci retracement level of 1996.06-2431.43 US dollars/ounce, and was unable to clearly rise above this level. Gold prices are also stuck near the bullish 20-day simple moving average (SMA), while technical indicators lack directional strength above the midline. Sellers don't seem to want to enter the market yet, while buyers are tepid in an attempt to resume their gains.
Bednarik added that in the short term, according to the 4-hour gold chart, technical data shows limited bullish potential. Gold prices are trading below the 20-period SMA and 100-period SMA. The former accelerates downward and falls below the latter, which is generally seen as a sign of increased selling pressure. Meanwhile, technical indicators are still at negative levels, momentum indicators are rising, and the Relative Strength Index (RSI) is consolidating around 43.
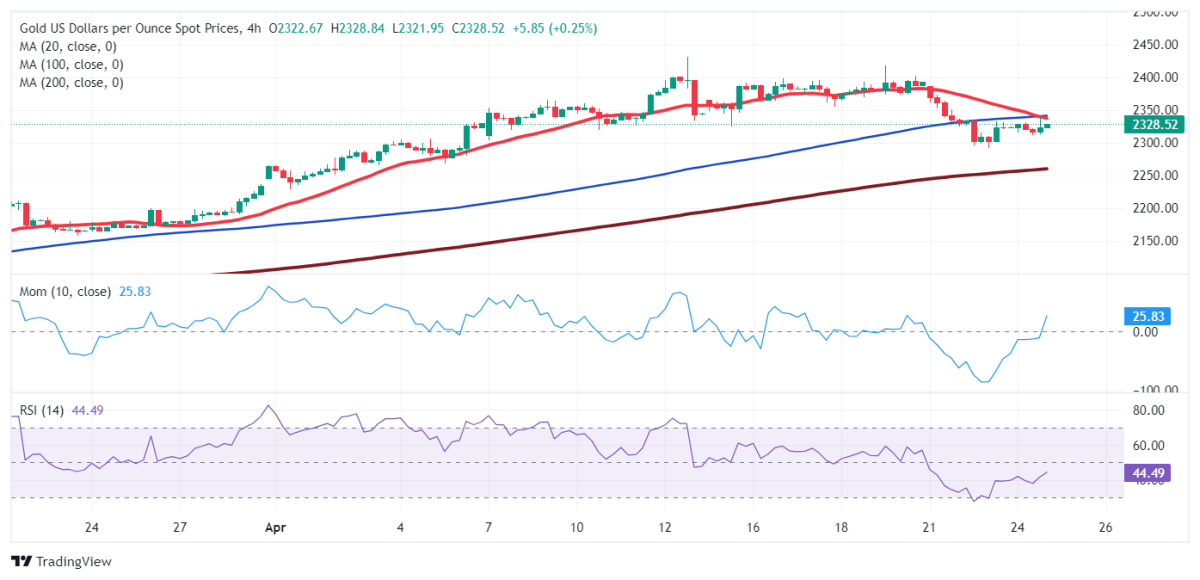
(Spot gold 4-hour chart source: FXStreet)
Bednarik gave the latest important support and resistance levels for gold prices:
Support levels: $2310.00/oz; $2295.20/oz; $2282.90/oz
Resistance levels: $2348.30/oz; $2361.55/ oz; $2372.90/oz
At 10:39 Beijing time, spot gold was reported at US$2321.48 per ounce.