JNJ Elliott Wave Analysis Trading Lounge Daily Chart.
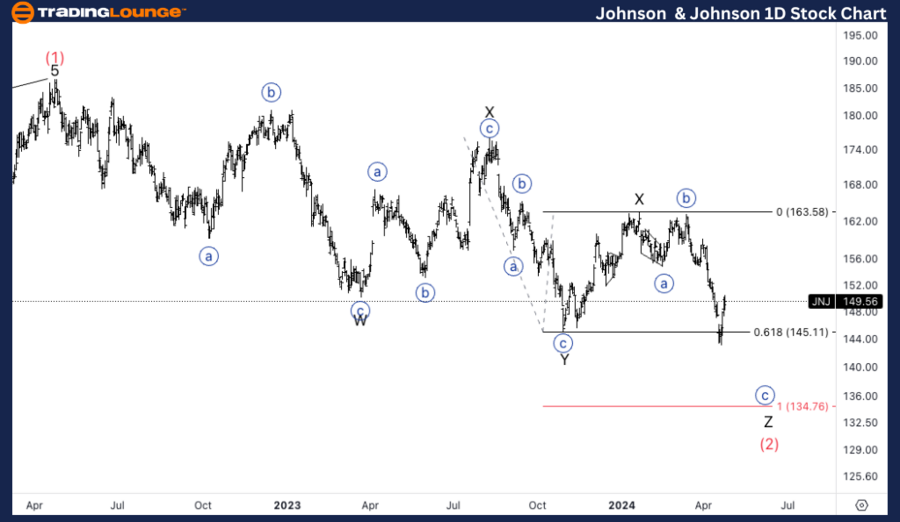
Johnson & Johnson, (JNJ) Daily Chart.
JNJ Elliott Wave technical analysis
Function: Counter Trend.
Mode: Corrective.
Structure: Complex.
Position: Intermediate (2).
Direction: Downside in wave Z.
Details: Looking for support as we touched 0.618 Z vs. X. If we find resistance on Medium Level at 150 then we can expected further downside.
JNJ Elliott Wave technical analysis – Daily chart
Johnson & Johnson is observed in a counter trend phase characterized by a complex corrective structure, specifically placed in Intermediate wave (2). Currently, the stock is progressing through the downside movements of wave Z. Key observations indicate the stock has reached the Fibonacci retracement level of 0.618 Z vs. X, signaling a potential area for finding support. Should resistance solidify at the medium level of $150, further downside could be expected as the pattern completes.
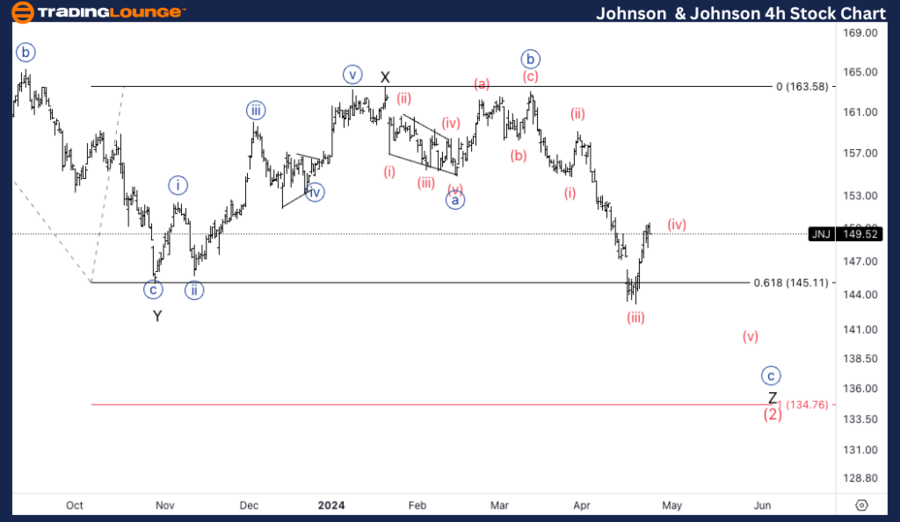
JNJ Elliott Wave Analysis Trading Lounge 4Hr Chart,
Johnson & Johnson, (JNJ) 4Hr Chart.
JNJ Elliott Wave technical analysis
Function: Trend.
Mode: Impulsive.
Structure: Motive.
Position: Wave (iv) of {c}.
Direction: Downside into wave (v).
Details: Looking to find resistance on 150, as wave (ii) was sharp we could anticipate a sideways wave (iv), to move around 150 itself.
On April 24, 2024, we conducted a comprehensive Elliott Wave analysis on Johnson & Johnson (Ticker: JNJ), focusing on the dynamics revealed through the daily and 4-hour chart studies. Our analysis highlights crucial patterns and potential future movements, offering valuable insights for traders and investors engaged in JNJ’s stock.
JNJ Elliott Wave technical analysis – Four hour chart
The 4-hour chart provides additional granularity into JNJ's Elliott Wave structure. Unlike the daily chart’s corrective mode, the intraday perspective shows an impulsive mode within a motive structure, pinpointing the stock in wave (iv) of {c}. This suggests that despite the broader correction, short-term dynamics involve impulsive downside movements. With wave (ii) noted as sharp, a contrasting sideways consolidation in wave (iv) is anticipated around $150, leading to a further decline in wave (v).
Technical analyst: Alessio Barretta.
JNJ Elliott Wave technical analysis [Video]
As with any investment opportunity there is a risk of making losses on investments that Trading Lounge expresses opinions on.
Historical results are no guarantee of future returns. Some investments are inherently riskier than others. At worst, you could lose your entire investment. TradingLounge™ uses a range of technical analysis tools, software and basic fundamental analysis as well as economic forecasts aimed at minimizing the potential for loss.
The advice we provide through our TradingLounge™ websites and our TradingLounge™ Membership has been prepared without considering your objectives, financial situation or needs. Reliance on such advice, information or data is at your own risk. The decision to trade and the method of trading is for you alone to decide. This information is of a general nature only, so you should, before acting upon any of the information or advice provided by us, consider the appropriateness of the advice considering your own objectives, financial situation or needs. Therefore, you should consult your financial advisor or accountant to determine whether trading in securities and derivatives products is appropriate for you considering your financial circumstances.
Recommended content
Editors’ Picks
EUR/USD holds steady near 1.0800 ahead of key events

EUR/USD stays in a consolidation phase at around 1.0800 early Tuesday after closing in positive territory on Monday. Market participants await ZEW sentiment data from Germany and the EU, producer inflation data from the US and Fed Chairman Powell's speech.
GBP/USD trades at around 1.2550 after UK jobs data

GBP/USD struggles to build on Monday's gains and hovers around 1.2550 in the European session on Tuesday. The data from the UK showed that the Unemployment Rate edged higher to 4.3% in the three months to March as forecast, failing to trigger a reaction.
Gold price edges higher ahead of US PPI data, Fed’s Powell speech

The gold price (XAU/USD) rebounds despite the consolidation of the US Dollar (USD) on Tuesday. The upside of yellow metal might be limited as traders might wait on the sidelines ahead of key US inflation data this week.
Top meme coins post gains following increased social activity amid GameStop pump

Meme coins in the crypto market saw impressive gains on Monday following a recent surge in GameStop stock. The increased attention surrounding these tokens signifies a potential resumption of the meme coin frenzy of March.
Entering a crucial run of data for financial markets
We are entering a crucial period for financial markets and forecasters as Americans' near-term inflation expectations rise again. Upcoming reports on the CPI and PPI for April, along with new data on retail sales and industrial production, will provide valuable insights.