
Howard Marks put it nicely when he said that, rather than worrying about share price volatility, 'The possibility of permanent loss is the risk I worry about... and every practical investor I know worries about.' It's only natural to consider a company's balance sheet when you examine how risky it is, since debt is often involved when a business collapses. We can see that John Bean Technologies Corporation (NYSE:JBT) does use debt in its business. But is this debt a concern to shareholders?
When Is Debt Dangerous?
Debt and other liabilities become risky for a business when it cannot easily fulfill those obligations, either with free cash flow or by raising capital at an attractive price. In the worst case scenario, a company can go bankrupt if it cannot pay its creditors. However, a more frequent (but still costly) occurrence is where a company must issue shares at bargain-basement prices, permanently diluting shareholders, just to shore up its balance sheet. Of course, debt can be an important tool in businesses, particularly capital heavy businesses. The first step when considering a company's debt levels is to consider its cash and debt together.
What Is John Bean Technologies's Debt?
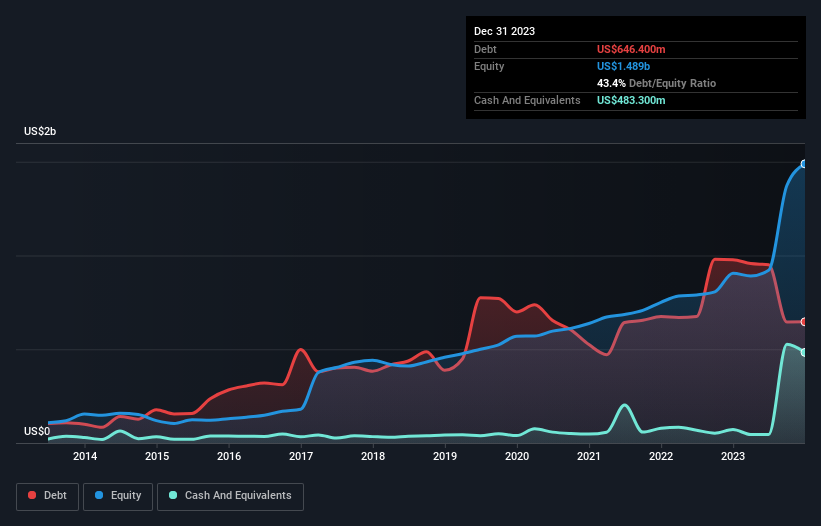
As you can see below, John Bean Technologies had US$646.4m of debt at December 2023, down from US$977.9m a year prior. On the flip side, it has US$483.3m in cash leading to net debt of about US$163.1m.
How Strong Is John Bean Technologies' Balance Sheet?
Zooming in on the latest balance sheet data, we can see that John Bean Technologies had liabilities of US$484.4m due within 12 months and liabilities of US$737.1m due beyond that. Offsetting this, it had US$483.3m in cash and US$288.9m in receivables that were due within 12 months. So it has liabilities totalling US$449.3m more than its cash and near-term receivables, combined.
Since publicly traded John Bean Technologies shares are worth a total of US$2.85b, it seems unlikely that this level of liabilities would be a major threat. Having said that, it's clear that we should continue to monitor its balance sheet, lest it change for the worse.
We measure a company's debt load relative to its earnings power by looking at its net debt divided by its earnings before interest, tax, depreciation, and amortization (EBITDA) and by calculating how easily its earnings before interest and tax (EBIT) cover its interest expense (interest cover). The advantage of this approach is that we take into account both the absolute quantum of debt (with net debt to EBITDA) and the actual interest expenses associated with that debt (with its interest cover ratio).
John Bean Technologies's net debt is only 0.63 times its EBITDA. And its EBIT easily covers its interest expense, being 16.6 times the size. So you could argue it is no more threatened by its debt than an elephant is by a mouse. Also good is that John Bean Technologies grew its EBIT at 20% over the last year, further increasing its ability to manage debt. There's no doubt that we learn most about debt from the balance sheet. But ultimately the future profitability of the business will decide if John Bean Technologies can strengthen its balance sheet over time. So if you're focused on the future you can check out this free report showing analyst profit forecasts.
Finally, a company can only pay off debt with cold hard cash, not accounting profits. So the logical step is to look at the proportion of that EBIT that is matched by actual free cash flow. In the last three years, John Bean Technologies's free cash flow amounted to 45% of its EBIT, less than we'd expect. That weak cash conversion makes it more difficult to handle indebtedness.
Our View
John Bean Technologies's interest cover suggests it can handle its debt as easily as Cristiano Ronaldo could score a goal against an under 14's goalkeeper. And the good news does not stop there, as its net debt to EBITDA also supports that impression! Taking all this data into account, it seems to us that John Bean Technologies takes a pretty sensible approach to debt. That means they are taking on a bit more risk, in the hope of boosting shareholder returns. Over time, share prices tend to follow earnings per share, so if you're interested in John Bean Technologies, you may well want to click here to check an interactive graph of its earnings per share history.
Of course, if you're the type of investor who prefers buying stocks without the burden of debt, then don't hesitate to discover our exclusive list of net cash growth stocks, today.
Have feedback on this article? Concerned about the content? Get in touch with us directly. Alternatively, email editorial-team (at) simplywallst.com.
This article by Simply Wall St is general in nature. We provide commentary based on historical data and analyst forecasts only using an unbiased methodology and our articles are not intended to be financial advice. It does not constitute a recommendation to buy or sell any stock, and does not take account of your objectives, or your financial situation. We aim to bring you long-term focused analysis driven by fundamental data. Note that our analysis may not factor in the latest price-sensitive company announcements or qualitative material. Simply Wall St has no position in any stocks mentioned.