
The KAMA Co.,Ltd. (SHSE:900953) share price has fared very poorly over the last month, falling by a substantial 38%. For any long-term shareholders, the last month ends a year to forget by locking in a 53% share price decline.
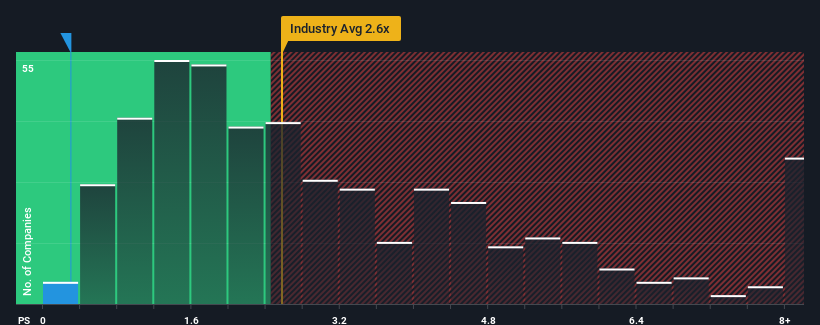
Since its price has dipped substantially, KAMALtd's price-to-sales (or "P/S") ratio of 0.3x might make it look like a strong buy right now compared to the wider Machinery industry in China, where around half of the companies have P/S ratios above 2.6x and even P/S above 5x are quite common. Nonetheless, we'd need to dig a little deeper to determine if there is a rational basis for the highly reduced P/S.
How Has KAMALtd Performed Recently?
We'd have to say that with no tangible growth over the last year, KAMALtd's revenue has been unimpressive. It might be that many expect the uninspiring revenue performance to worsen, which has repressed the P/S. If you like the company, you'd be hoping this isn't the case so that you could potentially pick up some stock while it's out of favour.
Although there are no analyst estimates available for KAMALtd, take a look at this free data-rich visualisation to see how the company stacks up on earnings, revenue and cash flow.Do Revenue Forecasts Match The Low P/S Ratio?
In order to justify its P/S ratio, KAMALtd would need to produce anemic growth that's substantially trailing the industry.
If we review the last year of revenue, the company posted a result that saw barely any deviation from a year ago. Whilst it's an improvement, it wasn't enough to get the company out of the hole it was in, with revenue down 24% overall from three years ago. Accordingly, shareholders would have felt downbeat about the medium-term rates of revenue growth.
Comparing that to the industry, which is predicted to deliver 24% growth in the next 12 months, the company's downward momentum based on recent medium-term revenue results is a sobering picture.
In light of this, it's understandable that KAMALtd's P/S would sit below the majority of other companies. Nonetheless, there's no guarantee the P/S has reached a floor yet with revenue going in reverse. Even just maintaining these prices could be difficult to achieve as recent revenue trends are already weighing down the shares.
What We Can Learn From KAMALtd's P/S?
Having almost fallen off a cliff, KAMALtd's share price has pulled its P/S way down as well. Typically, we'd caution against reading too much into price-to-sales ratios when settling on investment decisions, though it can reveal plenty about what other market participants think about the company.
It's no surprise that KAMALtd maintains its low P/S off the back of its sliding revenue over the medium-term. At this stage investors feel the potential for an improvement in revenue isn't great enough to justify a higher P/S ratio. Unless the recent medium-term conditions improve, they will continue to form a barrier for the share price around these levels.
And what about other risks? Every company has them, and we've spotted 1 warning sign for KAMALtd you should know about.
If these risks are making you reconsider your opinion on KAMALtd, explore our interactive list of high quality stocks to get an idea of what else is out there.
Have feedback on this article? Concerned about the content? Get in touch with us directly. Alternatively, email editorial-team (at) simplywallst.com.
This article by Simply Wall St is general in nature. We provide commentary based on historical data and analyst forecasts only using an unbiased methodology and our articles are not intended to be financial advice. It does not constitute a recommendation to buy or sell any stock, and does not take account of your objectives, or your financial situation. We aim to bring you long-term focused analysis driven by fundamental data. Note that our analysis may not factor in the latest price-sensitive company announcements or qualitative material. Simply Wall St has no position in any stocks mentioned.