
It hasn't been the best quarter for Stock Yards Bancorp, Inc. (NASDAQ:SYBT) shareholders, since the share price has fallen 11% in that time. On the bright side the share price is up over the last half decade. In that time, it is up 22%, which isn't bad, but is below the market return of 82%. While the long term returns are impressive, we do have some sympathy for those who bought more recently, given the 16% drop, in the last year.
Since the long term performance has been good but there's been a recent pullback of 4.0%, let's check if the fundamentals match the share price.
While markets are a powerful pricing mechanism, share prices reflect investor sentiment, not just underlying business performance. One flawed but reasonable way to assess how sentiment around a company has changed is to compare the earnings per share (EPS) with the share price.
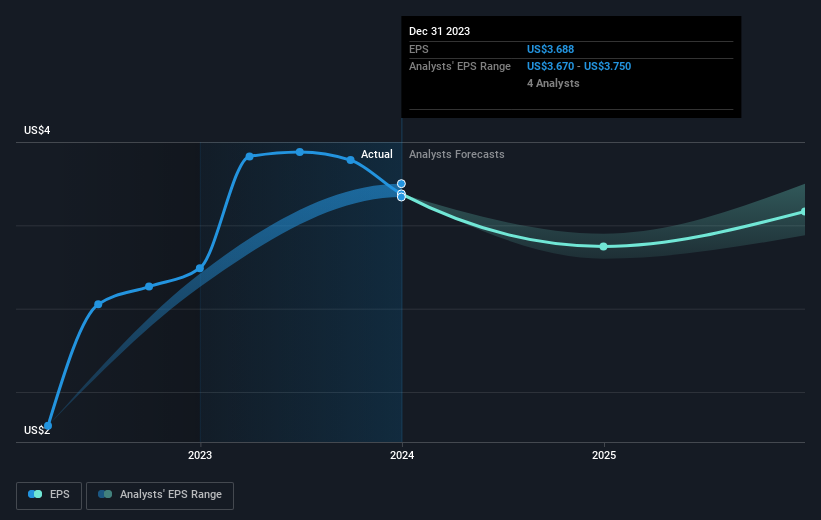
During five years of share price growth, Stock Yards Bancorp achieved compound earnings per share (EPS) growth of 8.4% per year. The EPS growth is more impressive than the yearly share price gain of 4% over the same period. So it seems the market isn't so enthusiastic about the stock these days. The reasonably low P/E ratio of 11.54 also suggests market apprehension.
You can see how EPS has changed over time in the image below (click on the chart to see the exact values).
We're pleased to report that the CEO is remunerated more modestly than most CEOs at similarly capitalized companies. But while CEO remuneration is always worth checking, the really important question is whether the company can grow earnings going forward. This free interactive report on Stock Yards Bancorp's earnings, revenue and cash flow is a great place to start, if you want to investigate the stock further.
What About Dividends?
It is important to consider the total shareholder return, as well as the share price return, for any given stock. The TSR incorporates the value of any spin-offs or discounted capital raisings, along with any dividends, based on the assumption that the dividends are reinvested. It's fair to say that the TSR gives a more complete picture for stocks that pay a dividend. As it happens, Stock Yards Bancorp's TSR for the last 5 years was 38%, which exceeds the share price return mentioned earlier. The dividends paid by the company have thusly boosted the total shareholder return.
A Different Perspective
Stock Yards Bancorp shareholders are down 13% for the year (even including dividends), but the market itself is up 23%. Even the share prices of good stocks drop sometimes, but we want to see improvements in the fundamental metrics of a business, before getting too interested. On the bright side, long term shareholders have made money, with a gain of 7% per year over half a decade. If the fundamental data continues to indicate long term sustainable growth, the current sell-off could be an opportunity worth considering. While it is well worth considering the different impacts that market conditions can have on the share price, there are other factors that are even more important. Consider risks, for instance. Every company has them, and we've spotted 1 warning sign for Stock Yards Bancorp you should know about.
Of course Stock Yards Bancorp may not be the best stock to buy. So you may wish to see this free collection of growth stocks.
Please note, the market returns quoted in this article reflect the market weighted average returns of stocks that currently trade on American exchanges.
Have feedback on this article? Concerned about the content? Get in touch with us directly. Alternatively, email editorial-team (at) simplywallst.com.
This article by Simply Wall St is general in nature. We provide commentary based on historical data and analyst forecasts only using an unbiased methodology and our articles are not intended to be financial advice. It does not constitute a recommendation to buy or sell any stock, and does not take account of your objectives, or your financial situation. We aim to bring you long-term focused analysis driven by fundamental data. Note that our analysis may not factor in the latest price-sensitive company announcements or qualitative material. Simply Wall St has no position in any stocks mentioned.