
Are Strong Financial Prospects The Force That Is Driving The Momentum In Zhejiang CONBA Pharmaceutical Co.,Ltd.'s SHSE:600572) Stock?
Are Strong Financial Prospects The Force That Is Driving The Momentum In Zhejiang CONBA Pharmaceutical Co.,Ltd.'s SHSE:600572) Stock?
Zhejiang CONBA PharmaceuticalLtd (SHSE:600572) has had a great run on the share market with its stock up by a significant 10% over the last three months. Since the market usually pay for a company's long-term fundamentals, we decided to study the company's key performance indicators to see if they could be influencing the market. In this article, we decided to focus on Zhejiang CONBA PharmaceuticalLtd's ROE.
浙江康巴制药有限公司(上海证券交易所代码:600572)在股票市场上表现良好,其股票在过去三个月中大幅上涨了10%。由于市场通常会为公司的长期基本面买单,因此我们决定研究公司的关键绩效指标,看看它们是否会影响市场。在本文中,我们决定重点介绍浙江康贝制药有限公司的投资回报率。
ROE or return on equity is a useful tool to assess how effectively a company can generate returns on the investment it received from its shareholders. Put another way, it reveals the company's success at turning shareholder investments into profits.
投资回报率或股本回报率是评估公司如何有效地从股东那里获得投资回报的有用工具。换句话说,它揭示了公司成功地将股东投资转化为利润。
How Do You Calculate Return On Equity?
你如何计算股本回报率?
Return on equity can be calculated by using the formula:
股本回报率可以使用以下公式计算:
Return on Equity = Net Profit (from continuing operations) ÷ Shareholders' Equity
股本回报率 = 净利润(来自持续经营业务)÷ 股东权益
So, based on the above formula, the ROE for Zhejiang CONBA PharmaceuticalLtd is:
因此,根据上述公式,浙江康贝制药有限公司的投资回报率为:
11% = CN¥856m ÷ CN¥7.5b (Based on the trailing twelve months to September 2023).
11% = 8.56亿元人民币 ÷ 75亿元人民币(基于截至2023年9月的过去十二个月)。
The 'return' is the profit over the last twelve months. Another way to think of that is that for every CN¥1 worth of equity, the company was able to earn CN¥0.11 in profit.
“回报” 是过去十二个月的利润。另一种看法是,每持有价值1元人民币的股权,公司就能获得0.11元人民币的利润。
What Is The Relationship Between ROE And Earnings Growth?
投资回报率与收益增长之间有什么关系?
We have already established that ROE serves as an efficient profit-generating gauge for a company's future earnings. Depending on how much of these profits the company reinvests or "retains", and how effectively it does so, we are then able to assess a company's earnings growth potential. Assuming all else is equal, companies that have both a higher return on equity and higher profit retention are usually the ones that have a higher growth rate when compared to companies that don't have the same features.
我们已经确定,投资回报率是衡量公司未来收益的有效盈利指标。然后,我们能够评估公司的收益增长潜力,具体取决于公司对这些利润进行再投资或 “保留” 了多少及其有效性。假设其他条件都一样,与功能不相同的公司相比,具有更高股本回报率和更高利润保留率的公司通常具有更高的增长率。
A Side By Side comparison of Zhejiang CONBA PharmaceuticalLtd's Earnings Growth And 11% ROE
浙江康贝制药有限公司的收益增长和11%的投资回报率的并排比较
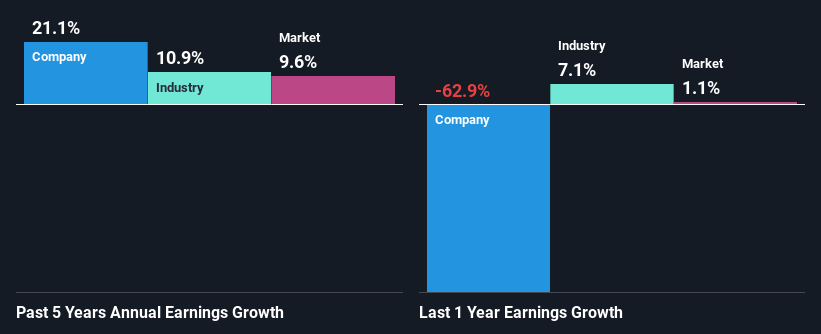
To begin with, Zhejiang CONBA PharmaceuticalLtd seems to have a respectable ROE. On comparing with the average industry ROE of 8.2% the company's ROE looks pretty remarkable. This certainly adds some context to Zhejiang CONBA PharmaceuticalLtd's exceptional 21% net income growth seen over the past five years. We reckon that there could also be other factors at play here. For instance, the company has a low payout ratio or is being managed efficiently.
首先,浙江康贝药业有限公司的投资回报率似乎不错。与8.2%的行业平均投资回报率相比,该公司的投资回报率看起来相当可观。这无疑为浙江康巴制药有限公司在过去五年中实现的21%的惊人净收入增长增添了一些背景信息。我们认为,这里可能还有其他因素在起作用。例如,该公司的派息率较低或管理效率很高。
We then compared Zhejiang CONBA PharmaceuticalLtd's net income growth with the industry and we're pleased to see that the company's growth figure is higher when compared with the industry which has a growth rate of 11% in the same 5-year period.
然后,我们将浙江康贝制药有限公司的净收入增长与该行业进行了比较,我们很高兴地看到,与同期5年同期增长率为11%的行业相比,该公司的增长数字更高。
The basis for attaching value to a company is, to a great extent, tied to its earnings growth. The investor should try to establish if the expected growth or decline in earnings, whichever the case may be, is priced in. By doing so, they will have an idea if the stock is headed into clear blue waters or if swampy waters await. Has the market priced in the future outlook for 600572? You can find out in our latest intrinsic value infographic research report.
为公司附加价值的基础在很大程度上与其收益增长息息相关。无论如何,投资者应设法确定预期的收益增长或下降是否已计入其中。通过这样做,他们将知道股票是走向清澈的蓝色海水还是沼泽水域在等着呢。市场在未来展望中是否定价为600572美元?你可以在我们最新的内在价值信息图研究报告中找到答案。
Is Zhejiang CONBA PharmaceuticalLtd Making Efficient Use Of Its Profits?
浙江康贝药业有限公司是否正在有效利用其利润?
Zhejiang CONBA PharmaceuticalLtd's three-year median payout ratio is a pretty moderate 36%, meaning the company retains 64% of its income. By the looks of it, the dividend is well covered and Zhejiang CONBA PharmaceuticalLtd is reinvesting its profits efficiently as evidenced by its exceptional growth which we discussed above.
浙江康巴制药有限公司的三年派息率中位数为36%,相当温和,这意味着该公司保留了64%的收入。从表面上看,股息覆盖范围很大,浙江康巴制药有限公司正在有效地对其利润进行再投资,我们上面讨论的其非凡增长就证明了这一点。
Moreover, Zhejiang CONBA PharmaceuticalLtd is determined to keep sharing its profits with shareholders which we infer from its long history of paying a dividend for at least ten years.
此外,浙江康巴制药有限公司决心继续与股东分享利润,这是我们从其支付股息至少十年的悠久历史中推断出来的。
Summary
摘要
Overall, we are quite pleased with Zhejiang CONBA PharmaceuticalLtd's performance. In particular, it's great to see that the company is investing heavily into its business and along with a high rate of return, that has resulted in a sizeable growth in its earnings. With that said, the latest industry analyst forecasts reveal that the company's earnings growth is expected to slow down. To know more about the company's future earnings growth forecasts take a look at this free report on analyst forecasts for the company to find out more.
总的来说,我们对浙江康巴药业有限公司的表现非常满意。特别是,很高兴看到该公司正在对其业务进行大量投资,再加上高回报率,这为其收益带来了可观的增长。话虽如此,最新的行业分析师预测显示,该公司的收益增长预计将放缓。要了解有关公司未来收益增长预测的更多信息,请查看这份关于分析师预测的免费报告,以了解更多信息。
Have feedback on this article? Concerned about the content? Get in touch with us directly. Alternatively, email editorial-team (at) simplywallst.com.
This article by Simply Wall St is general in nature. We provide commentary based on historical data and analyst forecasts only using an unbiased methodology and our articles are not intended to be financial advice. It does not constitute a recommendation to buy or sell any stock, and does not take account of your objectives, or your financial situation. We aim to bring you long-term focused analysis driven by fundamental data. Note that our analysis may not factor in the latest price-sensitive company announcements or qualitative material. Simply Wall St has no position in any stocks mentioned.
对这篇文章有反馈吗?对内容感到担忧?直接联系我们。 或者,给编辑团队 (at) simplywallst.com 发送电子邮件。
Simply Wall St的这篇文章本质上是笼统的。我们仅使用公正的方法根据历史数据和分析师的预测提供评论,我们的文章无意作为财务建议。它不构成买入或卖出任何股票的建议,也没有考虑到您的目标或财务状况。我们的目标是为您提供由基本数据驱动的长期重点分析。请注意,我们的分析可能不考虑最新的价格敏感型公司公告或定性材料。简而言之,华尔街没有持有任何上述股票的头寸。
译文内容由第三方软件翻译。