
Source: FX168 Finance
Intelligent Investing LLC and Northpost Partners LP founder Dr. Arnout Ter Schure said that after the Bitcoin price peaked, it has now bottomed out as expected and has flashed a potential bullish pattern of $98,000. If Bitcoin can stay above at least $56,000, the current consolidation is expected to be almost over, and a rebound to around $98,000 is imminent.
Arnout mentioned, “Three weeks ago, we showed that Bitcoin continued to follow a fractal pattern in the January 2021 correction, and according to the Elliott Wave Principle (EWP) analysis, Bitcoin is expected to bottom to around $57,500, close to the previously mentioned $55080 level, and the grey WC target area of $54,000-57,000.”
He continued his analysis: “Of course, Bitcoin doesn't have to follow the same path as 2021, and it may have bottomed out. More likely, it might provide us with a flat 3-3-5 correction, first targeting around $74,000 plus or minus $1,000, then falling back to $60,000 plus or minus $1,000 before takeoff. In any case, we are still optimistic about Bitcoin's long-term prospects. We expect its price to reach at least $100,000, with an adjusted upward target of $150,000 plus or minus $2,500.”
“Fast forward in time. Bitcoin hit a high of $72,750 on April 8 and then fell. Over the past three to four days, it has been trading at around $62,000 plus or minus $1,000. Therefore, our prediction for a flat 3-3-5 correction, first targeting about $74,000 plus or minus $1,000, and then falling back to about $60,000 plus or minus $1,000 before launch has now been realized.”
“That's the power of the Elliott Wave Theory because few people anticipated this path. Furthermore, our analysis of this amendment has so far not been proven to be wrong. As a result, we now expect adjustments to be in the final stages.”
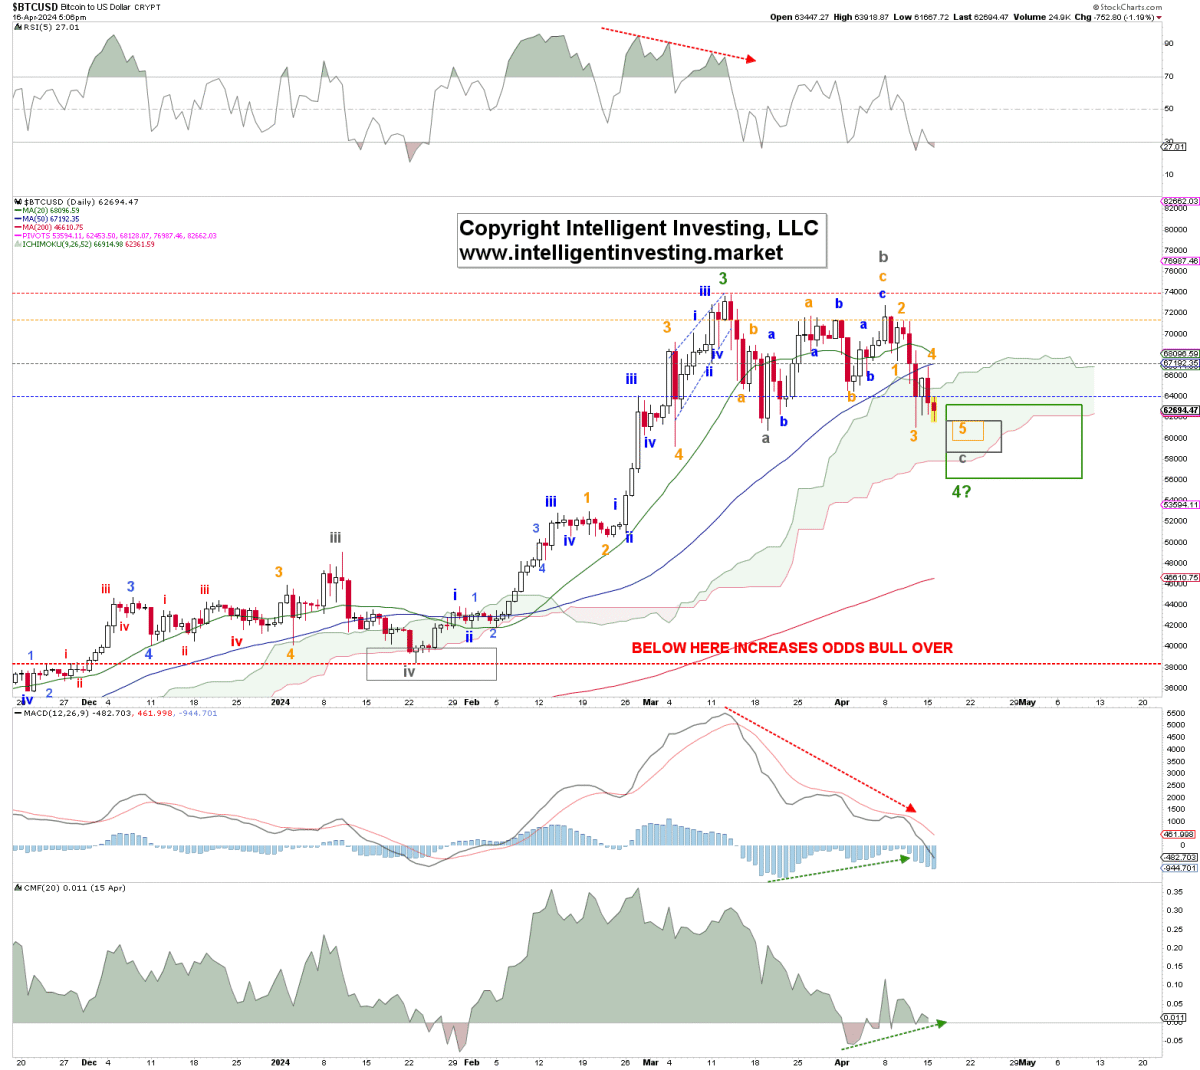
“As mentioned before, the flat correction (abc) includes a 3-3-5 pattern, and Bitcoin should now end the final orange fifth wave, ideally reaching $60,000-62,000, and possibly as low as $56,000-59,000. Once that's done, the next question is, how much do we expect the cryptocurrency to rise? We can use simple technical/chart pattern analysis to answer this question.”
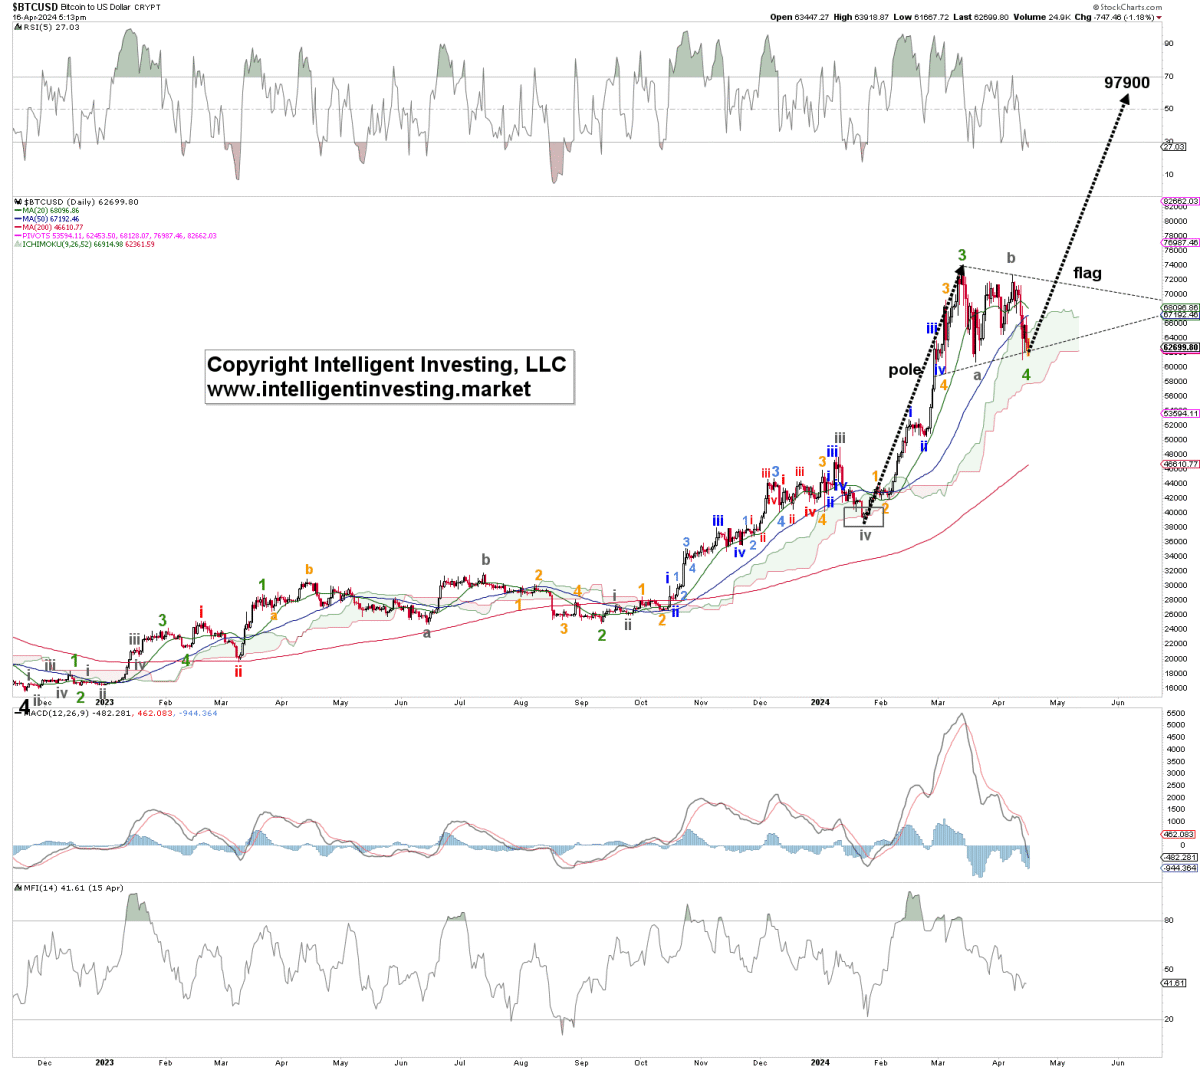
“The chart shows a potential bullflag pattern. The target price is around $98,000, which is 55% higher than the current level. In 2021, we saw a 100% rebound from our low, but that doesn't guarantee that it will happen now as well. In fact, given the declining yield pattern that Bitcoin follows, the logarithmic growth curve follows, the curve will flatten out over time, so it is more likely that the increase will be less than 100%.”
“The flag pattern is one of the most reliable continuing patterns because they are all very similar and often occur in situations similar to existing trends. However, as of now, this pattern has not been confirmed; it has only broken through the trend line above the flag. So while we're bullish on Bitcoin for a long time and expect it to reach $150,000 plus or minus $2,500, for now, this is a potential pattern, albeit very likely.”
edit/ruby