
It's possible to achieve returns close to the market-weighted average return by buying an index fund. But even in a market-beating portfolio, some stocks will lag the market. While the Xiamen ITG Group Corp.,Ltd (SHSE:600755) share price is down 17% over half a decade, the total return to shareholders (which includes dividends) was 8.0%. That's better than the market which declined 5.9% over the same time.
With that in mind, it's worth seeing if the company's underlying fundamentals have been the driver of long term performance, or if there are some discrepancies.
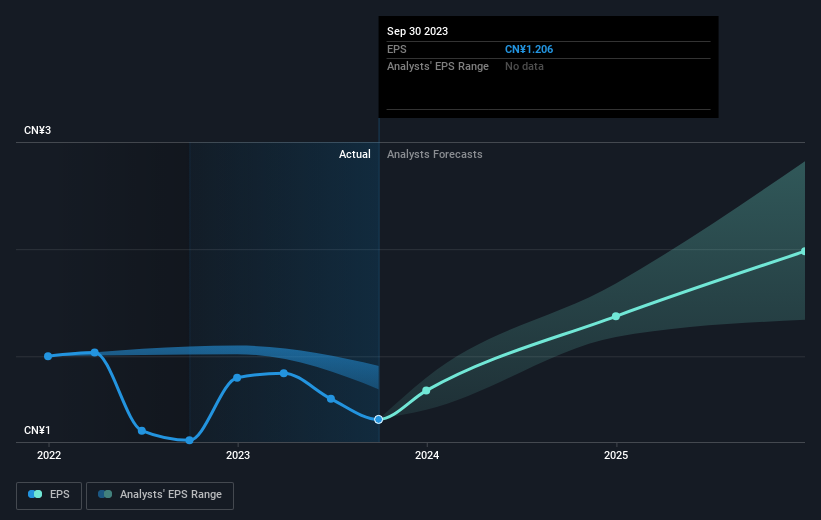
There is no denying that markets are sometimes efficient, but prices do not always reflect underlying business performance. One way to examine how market sentiment has changed over time is to look at the interaction between a company's share price and its earnings per share (EPS).
During the unfortunate half decade during which the share price slipped, Xiamen ITG GroupLtd actually saw its earnings per share (EPS) improve by 1.5% per year. So it doesn't seem like EPS is a great guide to understanding how the market is valuing the stock. Or possibly, the market was previously very optimistic, so the stock has disappointed, despite improving EPS.
Given that EPS has increased, but the share price has fallen, it's fair to say that market sentiment around the stock has become more negative. Having said that, if the EPS gains continue we'd expect the share price to improve, longer term.
You can see below how EPS has changed over time (discover the exact values by clicking on the image).
Before buying or selling a stock, we always recommend a close examination of historic growth trends, available here.
What About Dividends?
As well as measuring the share price return, investors should also consider the total shareholder return (TSR). Whereas the share price return only reflects the change in the share price, the TSR includes the value of dividends (assuming they were reinvested) and the benefit of any discounted capital raising or spin-off. Arguably, the TSR gives a more comprehensive picture of the return generated by a stock. In the case of Xiamen ITG GroupLtd, it has a TSR of 8.0% for the last 5 years. That exceeds its share price return that we previously mentioned. This is largely a result of its dividend payments!
A Different Perspective
While it's certainly disappointing to see that Xiamen ITG GroupLtd shares lost 8.8% throughout the year, that wasn't as bad as the market loss of 17%. Of course, the long term returns are far more important and the good news is that over five years, the stock has returned 1.6% for each year. It could be that the business is just facing some short term problems, but shareholders should keep a close eye on the fundamentals. While it is well worth considering the different impacts that market conditions can have on the share price, there are other factors that are even more important. Consider for instance, the ever-present spectre of investment risk. We've identified 1 warning sign with Xiamen ITG GroupLtd , and understanding them should be part of your investment process.
For those who like to find winning investments this free list of growing companies with recent insider purchasing, could be just the ticket.
Please note, the market returns quoted in this article reflect the market weighted average returns of stocks that currently trade on Chinese exchanges.
Have feedback on this article? Concerned about the content? Get in touch with us directly. Alternatively, email editorial-team (at) simplywallst.com.
This article by Simply Wall St is general in nature. We provide commentary based on historical data and analyst forecasts only using an unbiased methodology and our articles are not intended to be financial advice. It does not constitute a recommendation to buy or sell any stock, and does not take account of your objectives, or your financial situation. We aim to bring you long-term focused analysis driven by fundamental data. Note that our analysis may not factor in the latest price-sensitive company announcements or qualitative material. Simply Wall St has no position in any stocks mentioned.