
To the annoyance of some shareholders, Hangzhou Hopechart IoT Technology Co.,Ltd (SHSE:688288) shares are down a considerable 29% in the last month, which continues a horrid run for the company. For any long-term shareholders, the last month ends a year to forget by locking in a 50% share price decline.
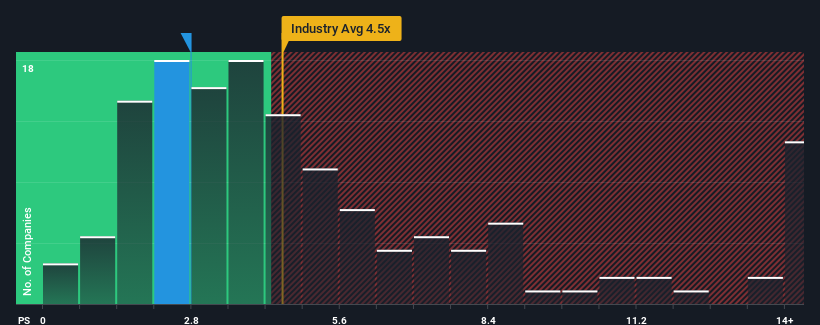
Following the heavy fall in price, Hangzhou Hopechart IoT TechnologyLtd's price-to-sales (or "P/S") ratio of 2.8x might make it look like a buy right now compared to the Software industry in China, where around half of the companies have P/S ratios above 4.5x and even P/S above 8x are quite common. However, the P/S might be low for a reason and it requires further investigation to determine if it's justified.
How Hangzhou Hopechart IoT TechnologyLtd Has Been Performing
With revenue growth that's exceedingly strong of late, Hangzhou Hopechart IoT TechnologyLtd has been doing very well. One possibility is that the P/S ratio is low because investors think this strong revenue growth might actually underperform the broader industry in the near future. Those who are bullish on Hangzhou Hopechart IoT TechnologyLtd will be hoping that this isn't the case, so that they can pick up the stock at a lower valuation.
Want the full picture on earnings, revenue and cash flow for the company? Then our free report on Hangzhou Hopechart IoT TechnologyLtd will help you shine a light on its historical performance.Do Revenue Forecasts Match The Low P/S Ratio?
There's an inherent assumption that a company should underperform the industry for P/S ratios like Hangzhou Hopechart IoT TechnologyLtd's to be considered reasonable.
Retrospectively, the last year delivered an exceptional 70% gain to the company's top line. Despite this strong recent growth, it's still struggling to catch up as its three-year revenue frustratingly shrank by 11% overall. Accordingly, shareholders would have felt downbeat about the medium-term rates of revenue growth.
Weighing that medium-term revenue trajectory against the broader industry's one-year forecast for expansion of 28% shows it's an unpleasant look.
In light of this, it's understandable that Hangzhou Hopechart IoT TechnologyLtd's P/S would sit below the majority of other companies. Nonetheless, there's no guarantee the P/S has reached a floor yet with revenue going in reverse. There's potential for the P/S to fall to even lower levels if the company doesn't improve its top-line growth.
The Final Word
The southerly movements of Hangzhou Hopechart IoT TechnologyLtd's shares means its P/S is now sitting at a pretty low level. Typically, we'd caution against reading too much into price-to-sales ratios when settling on investment decisions, though it can reveal plenty about what other market participants think about the company.
It's no surprise that Hangzhou Hopechart IoT TechnologyLtd maintains its low P/S off the back of its sliding revenue over the medium-term. Right now shareholders are accepting the low P/S as they concede future revenue probably won't provide any pleasant surprises either. Unless the recent medium-term conditions improve, they will continue to form a barrier for the share price around these levels.
And what about other risks? Every company has them, and we've spotted 2 warning signs for Hangzhou Hopechart IoT TechnologyLtd you should know about.
If companies with solid past earnings growth is up your alley, you may wish to see this free collection of other companies with strong earnings growth and low P/E ratios.
Have feedback on this article? Concerned about the content? Get in touch with us directly. Alternatively, email editorial-team (at) simplywallst.com.
This article by Simply Wall St is general in nature. We provide commentary based on historical data and analyst forecasts only using an unbiased methodology and our articles are not intended to be financial advice. It does not constitute a recommendation to buy or sell any stock, and does not take account of your objectives, or your financial situation. We aim to bring you long-term focused analysis driven by fundamental data. Note that our analysis may not factor in the latest price-sensitive company announcements or qualitative material. Simply Wall St has no position in any stocks mentioned.