
By buying an index fund, investors can approximate the average market return. But if you pick the right individual stocks, you could make more than that. Just take a look at Gansu Guofang Industry & Trade (Group) Co., Ltd. (SHSE:601086), which is up 43%, over three years, soundly beating the market decline of 20% (not including dividends).
Since the stock has added CN¥406m to its market cap in the past week alone, let's see if underlying performance has been driving long-term returns.
While markets are a powerful pricing mechanism, share prices reflect investor sentiment, not just underlying business performance. One imperfect but simple way to consider how the market perception of a company has shifted is to compare the change in the earnings per share (EPS) with the share price movement.
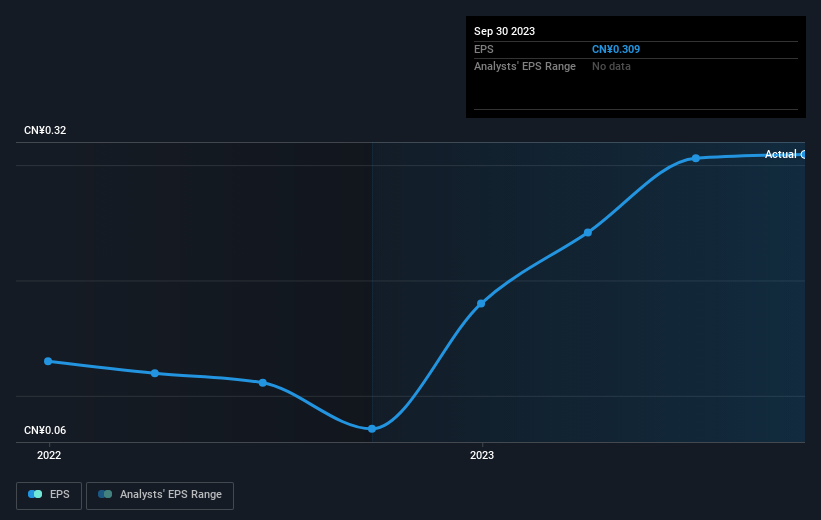
During three years of share price growth, Gansu Guofang Industry & Trade (Group) achieved compound earnings per share growth of 42% per year. This EPS growth is higher than the 13% average annual increase in the share price. So it seems investors have become more cautious about the company, over time.
The graphic below depicts how EPS has changed over time (unveil the exact values by clicking on the image).
It might be well worthwhile taking a look at our free report on Gansu Guofang Industry & Trade (Group)'s earnings, revenue and cash flow.
What About Dividends?
When looking at investment returns, it is important to consider the difference between total shareholder return (TSR) and share price return. Whereas the share price return only reflects the change in the share price, the TSR includes the value of dividends (assuming they were reinvested) and the benefit of any discounted capital raising or spin-off. It's fair to say that the TSR gives a more complete picture for stocks that pay a dividend. As it happens, Gansu Guofang Industry & Trade (Group)'s TSR for the last 3 years was 74%, which exceeds the share price return mentioned earlier. The dividends paid by the company have thusly boosted the total shareholder return.
A Different Perspective
It's good to see that Gansu Guofang Industry & Trade (Group) has rewarded shareholders with a total shareholder return of 42% in the last twelve months. That's including the dividend. Since the one-year TSR is better than the five-year TSR (the latter coming in at 1.8% per year), it would seem that the stock's performance has improved in recent times. Someone with an optimistic perspective could view the recent improvement in TSR as indicating that the business itself is getting better with time. While it is well worth considering the different impacts that market conditions can have on the share price, there are other factors that are even more important. Consider for instance, the ever-present spectre of investment risk. We've identified 2 warning signs with Gansu Guofang Industry & Trade (Group) , and understanding them should be part of your investment process.
Of course Gansu Guofang Industry & Trade (Group) may not be the best stock to buy. So you may wish to see this free collection of growth stocks.
Please note, the market returns quoted in this article reflect the market weighted average returns of stocks that currently trade on Chinese exchanges.
Have feedback on this article? Concerned about the content? Get in touch with us directly. Alternatively, email editorial-team (at) simplywallst.com.
This article by Simply Wall St is general in nature. We provide commentary based on historical data and analyst forecasts only using an unbiased methodology and our articles are not intended to be financial advice. It does not constitute a recommendation to buy or sell any stock, and does not take account of your objectives, or your financial situation. We aim to bring you long-term focused analysis driven by fundamental data. Note that our analysis may not factor in the latest price-sensitive company announcements or qualitative material. Simply Wall St has no position in any stocks mentioned.