
The Molecular Templates, Inc. (NASDAQ:MTEM) share price has fared very poorly over the last month, falling by a substantial 47%. For any long-term shareholders, the last month ends a year to forget by locking in a 71% share price decline.
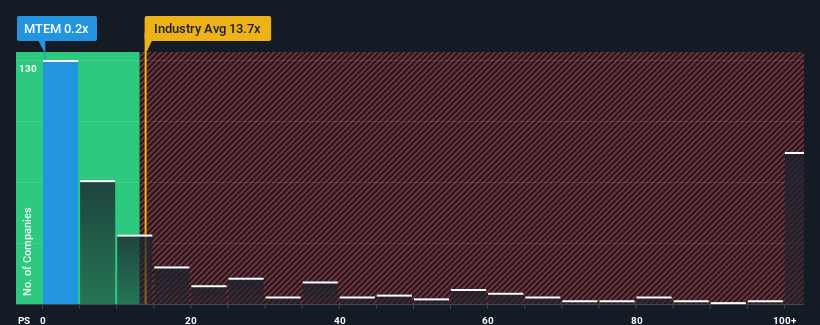
Since its price has dipped substantially, Molecular Templates may look like a strong buying opportunity at present with its price-to-sales (or "P/S") ratio of 0.2x, considering almost half of all companies in the Biotechs industry in the United States have P/S ratios greater than 13.7x and even P/S higher than 69x aren't out of the ordinary. However, the P/S might be quite low for a reason and it requires further investigation to determine if it's justified.
What Does Molecular Templates' P/S Mean For Shareholders?
Recent revenue growth for Molecular Templates has been in line with the industry. It might be that many expect the mediocre revenue performance to degrade, which has repressed the P/S ratio. If you like the company, you'd be hoping this isn't the case so that you could pick up some stock while it's out of favour.
If you'd like to see what analysts are forecasting going forward, you should check out our free report on Molecular Templates.How Is Molecular Templates' Revenue Growth Trending?
In order to justify its P/S ratio, Molecular Templates would need to produce anemic growth that's substantially trailing the industry.
Taking a look back first, we see that the company grew revenue by an impressive 190% last year. Pleasingly, revenue has also lifted 204% in aggregate from three years ago, thanks to the last 12 months of growth. Therefore, it's fair to say the revenue growth recently has been superb for the company.
Shifting to the future, estimates from the only analyst covering the company suggest revenue growth is heading into negative territory, declining 78% over the next year. That's not great when the rest of the industry is expected to grow by 148%.
With this in consideration, we find it intriguing that Molecular Templates' P/S is closely matching its industry peers. However, shrinking revenues are unlikely to lead to a stable P/S over the longer term. There's potential for the P/S to fall to even lower levels if the company doesn't improve its top-line growth.
The Final Word
Shares in Molecular Templates have plummeted and its P/S has followed suit. We'd say the price-to-sales ratio's power isn't primarily as a valuation instrument but rather to gauge current investor sentiment and future expectations.
With revenue forecasts that are inferior to the rest of the industry, it's no surprise that Molecular Templates' P/S is on the lower end of the spectrum. Right now shareholders are accepting the low P/S as they concede future revenue probably won't provide any pleasant surprises. Unless these conditions improve, they will continue to form a barrier for the share price around these levels.
And what about other risks? Every company has them, and we've spotted 6 warning signs for Molecular Templates (of which 2 don't sit too well with us!) you should know about.
If companies with solid past earnings growth is up your alley, you may wish to see this free collection of other companies with strong earnings growth and low P/E ratios.
Have feedback on this article? Concerned about the content? Get in touch with us directly. Alternatively, email editorial-team (at) simplywallst.com.
This article by Simply Wall St is general in nature. We provide commentary based on historical data and analyst forecasts only using an unbiased methodology and our articles are not intended to be financial advice. It does not constitute a recommendation to buy or sell any stock, and does not take account of your objectives, or your financial situation. We aim to bring you long-term focused analysis driven by fundamental data. Note that our analysis may not factor in the latest price-sensitive company announcements or qualitative material. Simply Wall St has no position in any stocks mentioned.