
 因此,
因此,The key date for the market to focus on is how much corn is planted on the ground as of May 15, particularly in the eight states where most of the crop is produced
Last week, the US Department of Agriculture (USDA) released its first “Crop Progress Report” for 2024, which is April 1. With very little corn and soybean growing in most states, and many fields being hit by heavy snow or spring storms, some readers may wonder if this is an April Fool's Day prank. Be clear, however, that this data is no joke for traders. They provide a national perspective, which is sometimes difficult to obtain, to understand what is happening on the ground. Furthermore, planting schedule is one of the key variables analysts use to predict corn production, long before the harvester starts operating.
While timeliness is critical, early planting is only one factor in the equation. Early bird birds did gain an advantage, but from a historical perspective, this advantage alone is not statistically significant enough. Moreover, from a national perspective, this is statistically irrelevant for soybeans.
 Therefore, the key date for the market to focus on is May 15 how much corn is planted in the field, particularly in the eight states where most of the crop is produced. Combined with the intense stress of June — if any — and the weather in July, this system isn't perfect. But last year it provided a warning that production was larger than many expected, which eventually led to a downward spiral in prices after the USDA confirmed the increase in its January annual estimate.
More crop data is always better
The multiple regression tool developed by USDA economists is just one way the Crop Progress Report helps target the moving target of production potential. Some people tend to use percentages of fields rated as good or excellent, while others assign points to different condition categories — 5 excellent, 4 good, etc. I've also adjusted these by using ratings from the 18 states that cover corn and weighting them based on the most recent current acreage reported by the USDA, rather than using the total amount reported from the previous year. The Crop Progress Report also covers more states: 18 each for corn and soybeans.
Some people disdain “Crop Progress Reports,” believing they are filled out by people who may not have the expertise or visit the counties they should be observing—like boring secretaries. Also, the data is subjective, and critics call it a “beauty contest,” although the USDA does provide criteria for classifying the rankers.
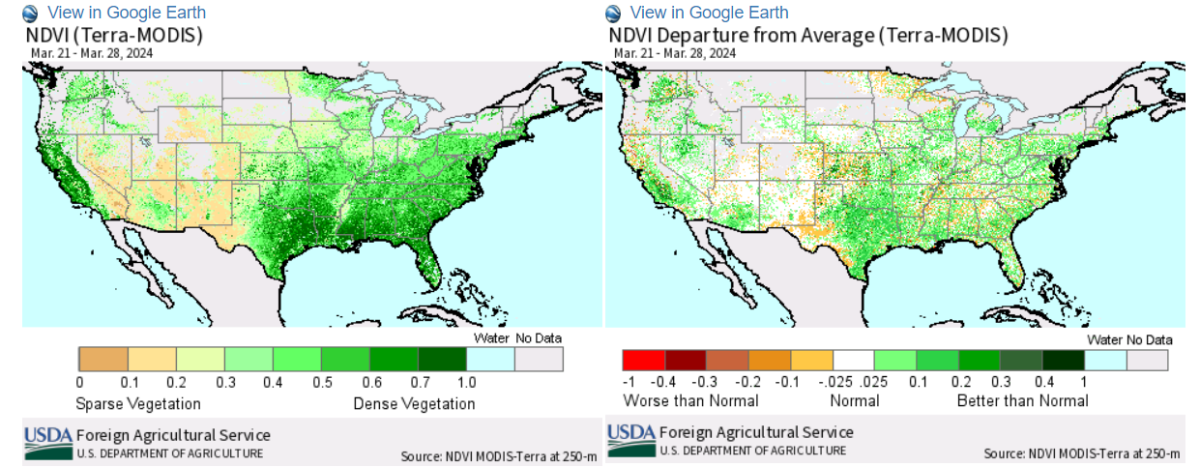
I also don't just rely on the weekly report forms that are usually published on Mondays during the growing season. Satellite tools such as the Vegetation Health Index are also useful, and are increasingly being used by people with significant computational power and geographic information system knowledge.
What is the most accurate yield prediction?
Last year, the Farm Futures January survey set corn yield at 176.1 bushels per acre, while the state-adjusted “Crop Progress Report” rating recommended a yield of 176 bushels per acre before the end of the growing season, while the USDA announced 177.6 bushels per acre.
October's soybean rating points to a yield of 51.1 bushels per acre, while the January Farm Futures survey was as low as 48.6 bushels per acre, and the USDA finally announced 50.6 bushels per acre. The results of vegetation maps and weather models are also different, but they also reflect changes in the direction of yield: when the last monthly estimate of January was made, corn yield increased and soybean yield declined.
This may be the key to using these forecasting methods. I looked through them all, downplayed the results that seemed to be outliers, and inserted the most likely suspects into my other models predicting prices and sales ranges. This also takes into account that the Vegetation Index becomes less effective as the growing season ends, and the “Crop Progress Report” status report ends when most fields are harvested.
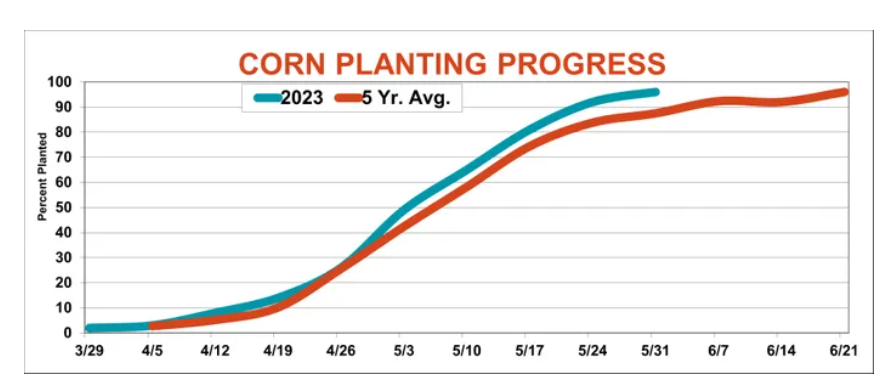
Growth reports won't begin until May or June, depending on how fast or slow the crop appears. Until then, corn cultivation progress was an indicator worth watching. Although the market likes to talk about 85% of the crop being planted in mid-May, the average value in 18 states is about 71%. Excluding slow years would raise this figure to 76%. Using only eight states in the weather model, these percentages were raised to 73% and 79%, but 85% was indeed a very fast year.
(The above analysis is from Bryce Knorr, Senior Grain Market Analyst at Farm Futures)
