
Many investors define successful investing as beating the market average over the long term. But if you try your hand at stock picking, your risk returning less than the market. We regret to report that long term Universal Corporation (NYSE:UVV) shareholders have had that experience, with the share price dropping 17% in three years, versus a market return of about 20%. In the last ninety days we've seen the share price slide 21%.
Given the past week has been tough on shareholders, let's investigate the fundamentals and see what we can learn.
In his essay The Superinvestors of Graham-and-Doddsville Warren Buffett described how share prices do not always rationally reflect the value of a business. One flawed but reasonable way to assess how sentiment around a company has changed is to compare the earnings per share (EPS) with the share price.
During the unfortunate three years of share price decline, Universal actually saw its earnings per share (EPS) improve by 28% per year. Given the share price reaction, one might suspect that EPS is not a good guide to the business performance during the period (perhaps due to a one-off loss or gain). Alternatively, growth expectations may have been unreasonable in the past.
It's worth taking a look at other metrics, because the EPS growth doesn't seem to match with the falling share price.
Given the healthiness of the dividend payments, we doubt that they've concerned the market. We like that Universal has actually grown its revenue over the last three years. If the company can keep growing revenue, there may be an opportunity for investors. You might have to dig deeper to understand the recent share price weakness.
You can see below how earnings and revenue have changed over time (discover the exact values by clicking on the image).
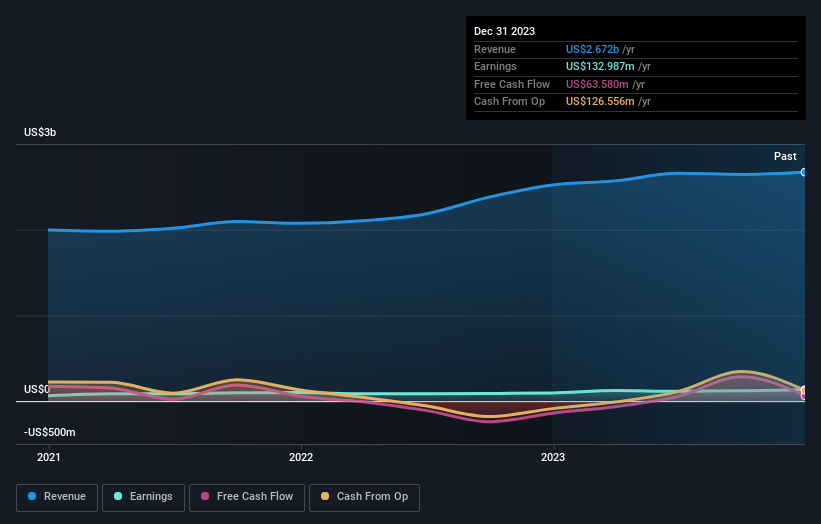
Balance sheet strength is crucial. It might be well worthwhile taking a look at our free report on how its financial position has changed over time.
What About Dividends?
As well as measuring the share price return, investors should also consider the total shareholder return (TSR). The TSR is a return calculation that accounts for the value of cash dividends (assuming that any dividend received was reinvested) and the calculated value of any discounted capital raisings and spin-offs. It's fair to say that the TSR gives a more complete picture for stocks that pay a dividend. As it happens, Universal's TSR for the last 3 years was -1.1%, which exceeds the share price return mentioned earlier. This is largely a result of its dividend payments!
A Different Perspective
Universal shareholders are down 2.9% for the year (even including dividends), but the market itself is up 28%. Even the share prices of good stocks drop sometimes, but we want to see improvements in the fundamental metrics of a business, before getting too interested. Longer term investors wouldn't be so upset, since they would have made 3%, each year, over five years. If the fundamental data continues to indicate long term sustainable growth, the current sell-off could be an opportunity worth considering. I find it very interesting to look at share price over the long term as a proxy for business performance. But to truly gain insight, we need to consider other information, too. For example, we've discovered 2 warning signs for Universal (1 can't be ignored!) that you should be aware of before investing here.
But note: Universal may not be the best stock to buy. So take a peek at this free list of interesting companies with past earnings growth (and further growth forecast).
Please note, the market returns quoted in this article reflect the market weighted average returns of stocks that currently trade on American exchanges.
Have feedback on this article? Concerned about the content? Get in touch with us directly. Alternatively, email editorial-team (at) simplywallst.com.
This article by Simply Wall St is general in nature. We provide commentary based on historical data and analyst forecasts only using an unbiased methodology and our articles are not intended to be financial advice. It does not constitute a recommendation to buy or sell any stock, and does not take account of your objectives, or your financial situation. We aim to bring you long-term focused analysis driven by fundamental data. Note that our analysis may not factor in the latest price-sensitive company announcements or qualitative material. Simply Wall St has no position in any stocks mentioned.